Both, Popups for Divi and Divi Areas Pro come with a powerful integrated debugger. Enabling the Debug-Mode can be done in the following ways:
Debugging features
There are several ways to enable a debugging feature.
- Debug Output in JS Console: All plugins
- Debug Output in code (“un-minified JS code”): Only Divi Areas Pro
wp-config.php
This section applies to: Popups for Divi, Divi Areas Pro
Out of the box, both plugins will observe the global variable WP_DEBUG to determine whether to “Enable Debug Output“.
Divi Areas Pro also observes SCRIPT_DEBUG to determine whether to “Output un-minified JS“.
<?php
define( 'WP_DEBUG', true ); // Enable output in JS Console (all plugins).
define( 'WP_DEBUG', false ); // Disable output in JS Console (all plugins).

define( 'SCRIPT_DEBUG', true ); // Output un-minified JS (Divi Areas Pro).
define( 'SCRIPT_DEBUG', false ); // Output minified JS (Divi Areas Pro).

define( 'DIVIMODE_DEBUG', true ); // Output additional details in un-minified JS.
PHP filter
This section applies to: Popups for Divi, Divi Areas Pro
Use the WordPress filter divi_areas_js_data to manually override the “Enable Debug Output” state:
<?php
add_filter( 'divi_areas_js_data', 'my_custom_js_data' );

function my_custom_js_data( $config ) {
    $config['debug'] = true; // Enable output in JS Console.
    return $config;
}
Divi Areas Pro offers the filter divi_areas_output_unminified_js to manually set the state of “Output un-minified JS”:
<?php
// Output un-minified JS:
add_filter( 'divi_areas_output_unminified_js', '__return_true' );

// Output minified JS:
add_filter( 'divi_areas_output_unminified_js', '__return_false' );
Divi Areas Pro Settings
This section only applies to Divi Areas Pro
You can also manually enable or permanently disable the debugger via the Divi Areas > Settings page, inside the Front-End tab.
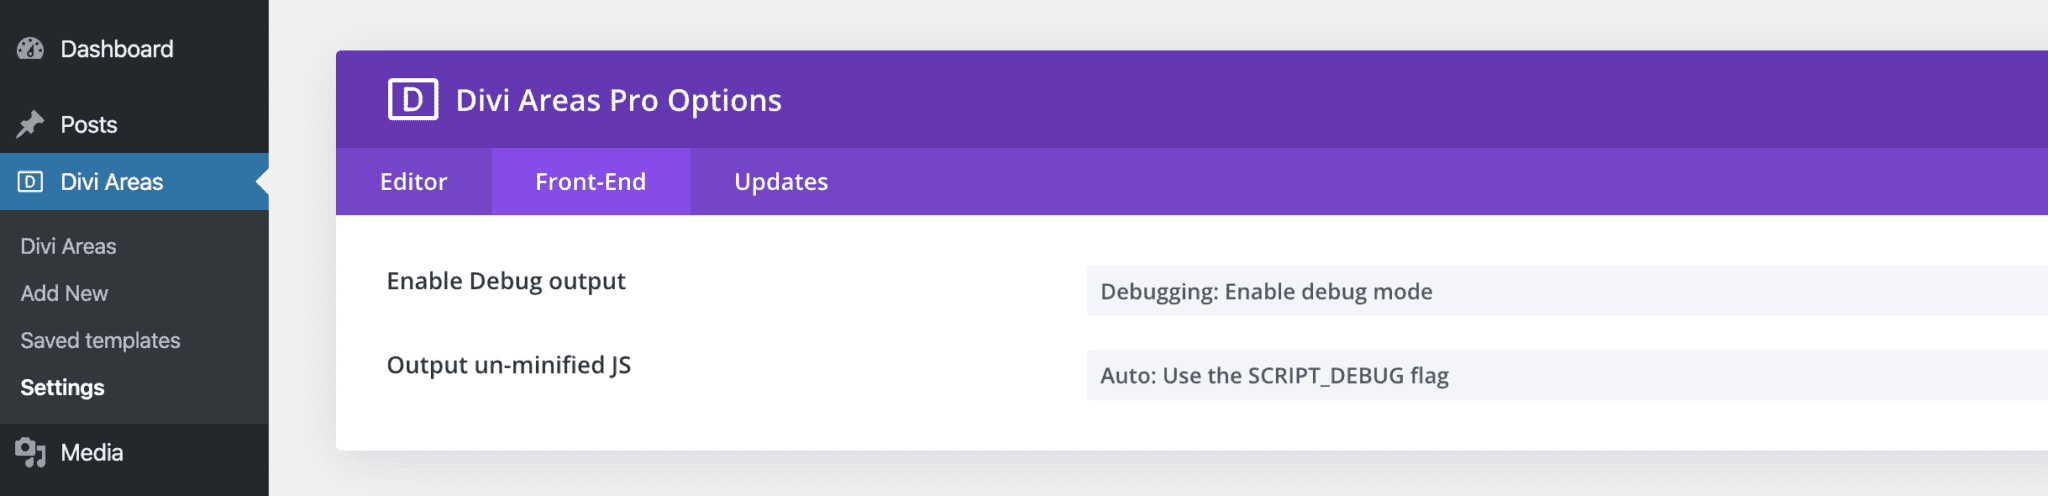
Output in JS Console
This section applies to: Popups for Divi, Divi Areas Pro
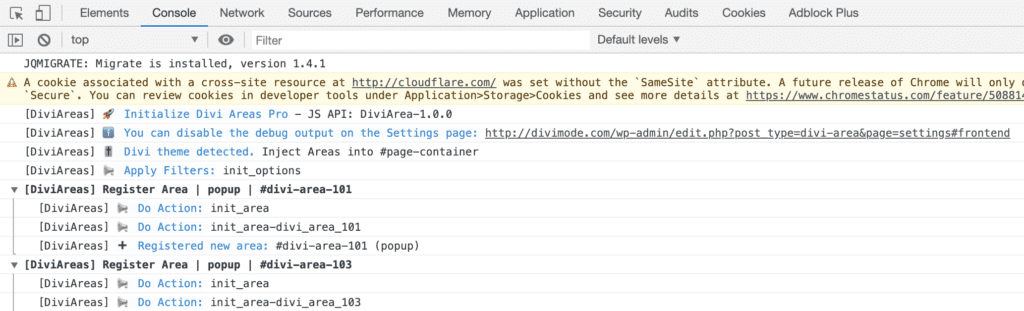
When enabled, the JS API will display a ton of information that tells you, what exactly happens, and why. To see the debug output, open your browsers JS console and reload a page that contains a Divi Area.
Related article: How can I access the JS console
The debug output is visible to all users, both logged-in and guests, so it’s best to only use it on a development or staging site. if you enable it on a production website, remember to disable it again once you are done.
Default output in your JS console
Tip: Filter and Debug Levels
Every debug output that is generated by Divi Areas Pro uses the Prefix “[DiviAreas]”. You can use the Console’s Filter to quickly hide all other messages. Also, make sure to play with the Debug-Level options to see what kind of debug information is available.
Output un-minified JS
This section only applies to Divi Areas Pro
Every Divi Area injects a one-line JS snippet on your pages to register the Area and set up your custom triggers. You can find this snippet, by examining your website source code and searching for the term “DiviArea”.
Related article: How can I search the website source
Here’s an example of the minified JS snippet:
When the option “Output un-minified JS” is enabled, the same script is output like this:

The minification is done by a simple string translation without using external libraries. It’s super fast and reliable.