Errors on your Divi site and no idea what they are? Try this method! This is an easy way to check your console for errors.
Checking your browser console for errors is a crucial skill when it comes to website troubleshooting. Unfortunately, many individuals are not well-versed in this area. It is easier than people realize to check for errors before reaching out to others to assist with website issues. This tutorial is for beginners unfamiliar with the console in the browser developer tools. We will guide you through the process of checking your Console for errors on your Divi website. Curious? Keep reading!
Table of Contents
How To Access The Console
Open The Browser Developer Tools
To open your browser developer tools, right-click anywhere on your website’s page. A tooltip menu will appear. Select “Inspect” at the bottom of the menu to open the developer tools panel either on the side or bottom of your screen.
Pro Tip: If you are using the Divi Visual Builder or a Divi Theme Builder template, you may not be able to right-click. In such cases, hover over the black admin bar at the top and right-click.
Find The Console Tab
Once you open the browser tools, you’ll notice several tabs at the top such as Element, Network, Console, Performance, and more. You can widen the window or use a compact menu to uncover additional hidden items. The “Console” tab is typically the second one, and it’s the one you’re after.

*Related Article – Best Cookie Plugins for WordPress in 2023 (Compared)
Checking Warnings & Errors In The Console
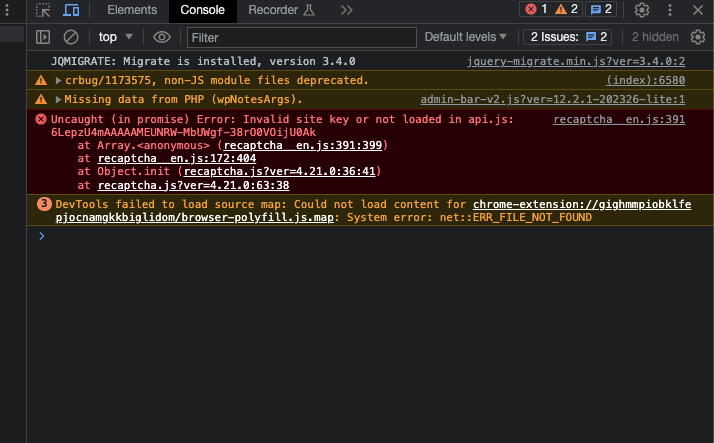
When you open the Console, it may seem overwhelming, but you don’t need to comprehend everything. Our objective today is to teach you how to identify errors and locate them on your website. You don’t have to know how to resolve all of them.
What Will You Find?
You will find A LOT of things on your console. We can’t give you a list of all the common errors and warnings you may encounter, but we can highlight a few general ones. Specific issues you encounter will depend on factors such as your server, software versions, code libraries, Divi versions, plugin versions, and various combinations of code and plugins.
Sometimes you may see yellow warning icons. These are not quite as urgent as a red x, but they are trying to alert you to some issues. Sometimes they can even be ignored, but if you are unsure about anything that seems important, it is best to have a developer check them. One of the most common warnings will be a mixed content error.
As an example, if it is an issue with mixed content, the error message will give you some basic information and will start with “Mixed Content” and after say, “the page at https://www.example.com is loaded over HTTPS but requested an insecure image http://www.imageurl and this content should also be served over HTTPS.”
Follow The Path
Just to give you a quick tip, there will always be indicators of where your problem is on your website. Sometimes it will have a URL path – if so, you need to please follow it.
If you have an error on your website with the Divi Areas Pro plugin, there might be an error coming from the Divi Theme itself. You will be able to see this in your console if you just follow the path.
Research Any Error Numbers
Another common error type is a server error, such as 500 error, 504, and 403. When you encounter these errors in the Console, simply enter them into a search engine to find information about them. In most cases, you will need to review your server requirements and reach out to your hosting provider’s support for assistance.
Conclusion
Checking the console on your Divi site can save you time and prevent headaches when troubleshooting issues. Developing this habit will benefit you in the long run! Just a little tip from the Divimode team. 😉

Try Divi Areas Pro today
Sounds interesting? Learn more about Divi Areas Pro and download your copy now!
Many pre-designed layouts. Automated triggers. No coding.
Click here for more details


