Checking for website errors is so much more than just ticking off a box on your IT to-do list. It’s about actively protecting your user experience, safeguarding your SEO rankings, and ultimately, your bottom line. These sneaky issues can range from something as simple as a broken link to a critical security flaw, and catching them early is a core business strategy.
Think of it as preventative maintenance. Proactive checks stop minor glitches from snowballing into major disasters that scare customers away for good.
Why Website Errors Are More Than Just Glitches
Let's be real—seeing an error pop up on your own site feels like a punch to the gut. But these problems are far more than just a minor annoyance. They're the silent killers of user trust and conversions.
A single broken payment link can torpedo a sale right at the finish line. Slow-loading scripts can send impatient visitors bouncing straight to a competitor. These seemingly small hiccups create a ripple effect that can seriously damage your brand. When a visitor hits a "404 Not Found" page, they might just assume your business is unprofessional or, worse, defunct. That's a first impression you can't afford to make.

The Hidden Costs of Glitches and Downtime
Beyond frustrating your users, website errors carry a very real financial price tag. Every single minute your site is down, broken, or just plain buggy is a minute you aren't making sales, generating leads, or connecting with your audience.
The threat is constant. The average website weathers around 94 attacks every single day, with automated bots probing for weaknesses thousands of times a week. The financial fallout from a breach or significant downtime is staggering. A whopping 91% of companies report that just one hour of downtime costs them at least $300,000. That number should make anyone sit up and pay attention.
This is exactly why a proactive mindset is non-negotiable. Instead of scrambling to put out fires after the damage is done, a routine of regularly checking for errors keeps you one step ahead.
Proactive error checking isn't just technical maintenance; it's a fundamental business strategy. Treating your website's health as a critical asset protects your revenue, reputation, and relationship with your customers.
How Errors Tank Your SEO Rankings
Search engines like Google are obsessed with providing a seamless user experience. When their crawlers repeatedly stumble upon errors on your site, it sends a clear signal: this site might be low-quality or poorly maintained. And that can directly hammer your search rankings.
Here are a few ways errors poison your SEO efforts:
- Wasted Crawl Budget: If the Googlebot keeps hitting 404 pages or server errors, it wastes its limited time allocated to your site. This means your most important pages might never get indexed properly.
- Sky-High Bounce Rates: Slow load times or broken features make users leave in a heartbeat. A high bounce rate screams to search engines that your site isn't delivering value, pushing you further down the results page.
- Security Red Flags: If your site has security holes, like mixed content errors, browsers might flash big, scary warnings to visitors. This kills traffic and demolishes trust in an instant.
The key is to shift from reactive fixes to a process of continuous improvement. Keeping your site in peak condition isn't a one-time project; it’s an ongoing commitment. For a deeper dive, check out our guide on how Divi performance optimization can help you build a more robust and reliable site. By making health checks a regular habit, you ensure your digital storefront is always open, secure, and ready for business.
Your First Look Using Browser Developer Tools
You don't need to be a seasoned developer to start digging into what’s happening "under the hood" of your website. In fact, one of the most powerful diagnostic tools you have is already built right into your web browser. We're talking about Developer Tools, and they are your first line of defense when you need to figure out what's gone wrong.
Think of these tools as an X-ray for your website. While a visitor only sees the finished page, Developer Tools let you peek at the underlying structure—the code, the scripts, and all the network requests that bring your site to life. This immediate access is perfect for catching problems as they happen, without having to install a single piece of software.
Getting to them is simple. In most browsers like Chrome, Firefox, or Edge, just right-click anywhere on your webpage and select "Inspect" or "Inspect Element." A quick keyboard shortcut works too, like F12 on Windows or Cmd+Option+I on a Mac. The panel might look a bit intimidating at first, but we're only going to focus on two key areas for now.
Uncovering Clues in the Console Tab
The first and most important place to hunt for trouble is the Console tab. Think of the Console as a live log of your website's activity. As your page loads, the browser records important messages here, including warnings and—most critically—errors.
Let's imagine a real-world scenario. A customer emails you saying your contact form is broken. They click "Submit," but nothing happens. This is a classic case where the Console can give you an instant answer. You'd open the Developer Tools, head over to the contact page, and try to submit the form yourself.
If there's an issue, you'll almost certainly see a bright red error message pop up in the Console. These messages are often the smoking gun. They might point to a JavaScript conflict from a recently updated plugin or a misconfigured script that’s stopping the form from sending.
The Console is your direct line to the browser's brain. Red error messages aren't just technical jargon; they are specific clues telling you exactly what went wrong and often where to start looking for a fix. Ignoring them is like ignoring your car's check engine light.
For those running on specific platforms, knowing how to read these messages is even more crucial. We've put together a detailed walkthrough specifically for Divi users in our guide on how to check the console for errors on your Divi website, complete with examples to help you diagnose issues much faster.
This is what a typical view of the Chrome Developer Tools looks like, with the Console tab active.

As you can see, errors, warnings, and other logs are clearly marked, letting you zero in on the critical red messages that signal a problem.
Watching Your Site Load With the Network Tab
The second area you'll want to get familiar with is the Network tab. This tab gives you a detailed waterfall chart showing every single file your browser has to request and download to display your webpage. We’re talking images, stylesheets (CSS), scripts (JavaScript), and fonts.
The Network tab is your go-to tool for hunting down performance bottlenecks and finding missing resources. After opening it, you might need to refresh the page to see all the requests fill in. Each line represents a single resource, and you can see critical details at a glance.
Here’s what to look for in the Network tab:
- Status Codes: Keep a close eye on the "Status" column. A status of 200 means everything is okay. But if you see a 404, that's a problem. It means the browser tried to load something (like an image or script) but couldn't find it. This is a classic "broken link" issue that leads to missing images or broken features.
- Slow Load Times: The "Time" or "Latency" column shows exactly how long each file took to download. If you spot one particular file taking several seconds to load, you've just found a major performance drag. It could be a massive, unoptimized image or a slow third-party script slowing your entire page down.
- File Sizes: The "Size" column helps you spot assets that are way too big. A single 5 MB background image can absolutely cripple your site's speed on a mobile connection. Identifying these oversized files is the first step toward fixing them.
By using the Console and Network tabs together, you can perform a surprisingly deep health check on any page of your site. You can spot JavaScript conflicts that break your forms, find missing images that leave ugly blank spaces, and pinpoint the exact files making your site feel sluggish. This initial investigation empowers you to either fix the simple problems yourself or give your developer precise, actionable information—saving everyone time and frustration.
Decoding the Most Common Website Errors
When you start digging in to check for website errors, you'll quickly find they come in two flavors. First, you have the big, obvious problems that smack your visitors right in the face—think of the dreaded "404 Not Found" page. The second group is a lot sneakier, made up of issues lurking behind the scenes, like broken code or rendering glitches that slowly chip away at the user experience.
Getting a handle on both is non-negotiable. While a 404 error is a clear sign something's wrong, messy HTML or CSS can quietly make your site slow, inaccessible, or just plain busted on certain devices. Let’s run through the usual suspects so you know what you're looking for.
Client-Side Errors Your Visitors See
These are the errors your audience runs into directly, usually flagged by a specific HTTP status code. We call them "client-side" because the issue is with the user's browser (the client) failing to get what it asked for from your server.
The most common culprit is the 404 Not Found error. This just means the browser connected to your server, but the page it requested doesn't exist at that URL. This usually pops up from a broken link, a typo in the address bar, or a page you deleted without setting up a redirect. A single 404 isn't a disaster, but a site littered with them is a red flag to search engines that it's poorly maintained.
Another one to keep an eye on is the 403 Forbidden error. This one's all about permissions. Your server got the request loud and clear but is flat-out refusing access. It's like knocking on a door you don't have the key for. This can be triggered by incorrect file permissions on your server or specific security rules designed to block certain kinds of traffic.
Server-Side Errors Hiding in the Background
Server-side errors are usually a much bigger deal because they point to a problem with the server itself or the software running on it. The user’s request was perfectly valid, but something on your end broke while trying to process it.
The most infamous is the 500 Internal Server Error. This is the ultimate "something went wrong" message. It’s incredibly frustrating for everyone because it gives zero clues about the cause. The problem could be anything from a buggy plugin or a corrupted .htaccess file. These are high-priority fires to put out, as they can knock your entire site offline.
Similarly, a 503 Service Unavailable error means your server is just temporarily overwhelmed. This might happen if your site gets a massive, unexpected traffic spike or if it's down for maintenance. It tells the browser to try again later, but for a visitor, it still means your site is out of commission.
Think of client-side errors like a mail carrier trying to deliver a letter to an address that doesn't exist (a 404). Server-side errors are like the post office itself being closed for some unknown reason (a 500)—the problem is at the source, not with the delivery attempt.
Here’s a quick-reference table to help you make sense of the most common error codes you're likely to encounter.
Common HTTP Status Codes and What They Mean for Your Site
| Error Code | Name | Meaning | Common Cause |
|---|---|---|---|
| 400 | Bad Request | The server couldn't understand the request due to malformed syntax. | A user's browser, a proxy, or your own code is sending a flawed request. |
| 403 | Forbidden | The server understood the request but is refusing to authorize it. | Incorrect file/folder permissions, or a security rule (like an IP block). |
| 404 | Not Found | The requested resource could not be found on the server. | Broken internal links, mistyped URLs, or deleted pages without redirects. |
| 500 | Internal Server Error | A generic error message, given when an unexpected condition was encountered. | Corrupted .htaccess file, faulty plugins/themes, PHP memory limits exceeded. |
| 502 | Bad Gateway | One server on the internet received an invalid response from another server. | Issues with your hosting server, a proxy server, or a CDN. |
| 503 | Service Unavailable | The server is not ready to handle the request. | The server is overloaded with traffic, or it is down for maintenance. |
| 504 | Gateway Timeout | The server, while acting as a gateway or proxy, did not get a response in time. | Network connectivity issues between servers, or a script taking too long. |
Keep this handy. Knowing what these codes mean will save you a ton of time when you're troubleshooting.
The Invisible Problem of Code Validation Errors
Beyond HTTP status codes, another critical—and often ignored—area to check for website errors is the code itself. I'm talking about HTML and CSS. Modern browsers are incredibly forgiving and do their best to render pages even with messy code, but these validation errors are like technical debt that will eventually come back to bite you.
Poorly written HTML can cause serious accessibility problems, making it a nightmare for screen readers to navigate your content. It also leads to pages displaying incorrectly or inconsistently across different browsers, which is a surefire way to frustrate users. Unfortunately, this is a massive issue online. A recent analysis found that among the world's top 200 websites, none had fully valid HTML on their homepages in 2025. The average number of HTML validation errors per page has climbed to a staggering 110.45. You can explore more data on this topic and see how it’s affecting web standards.
The infographic below really drives home just how common these invisible errors are.
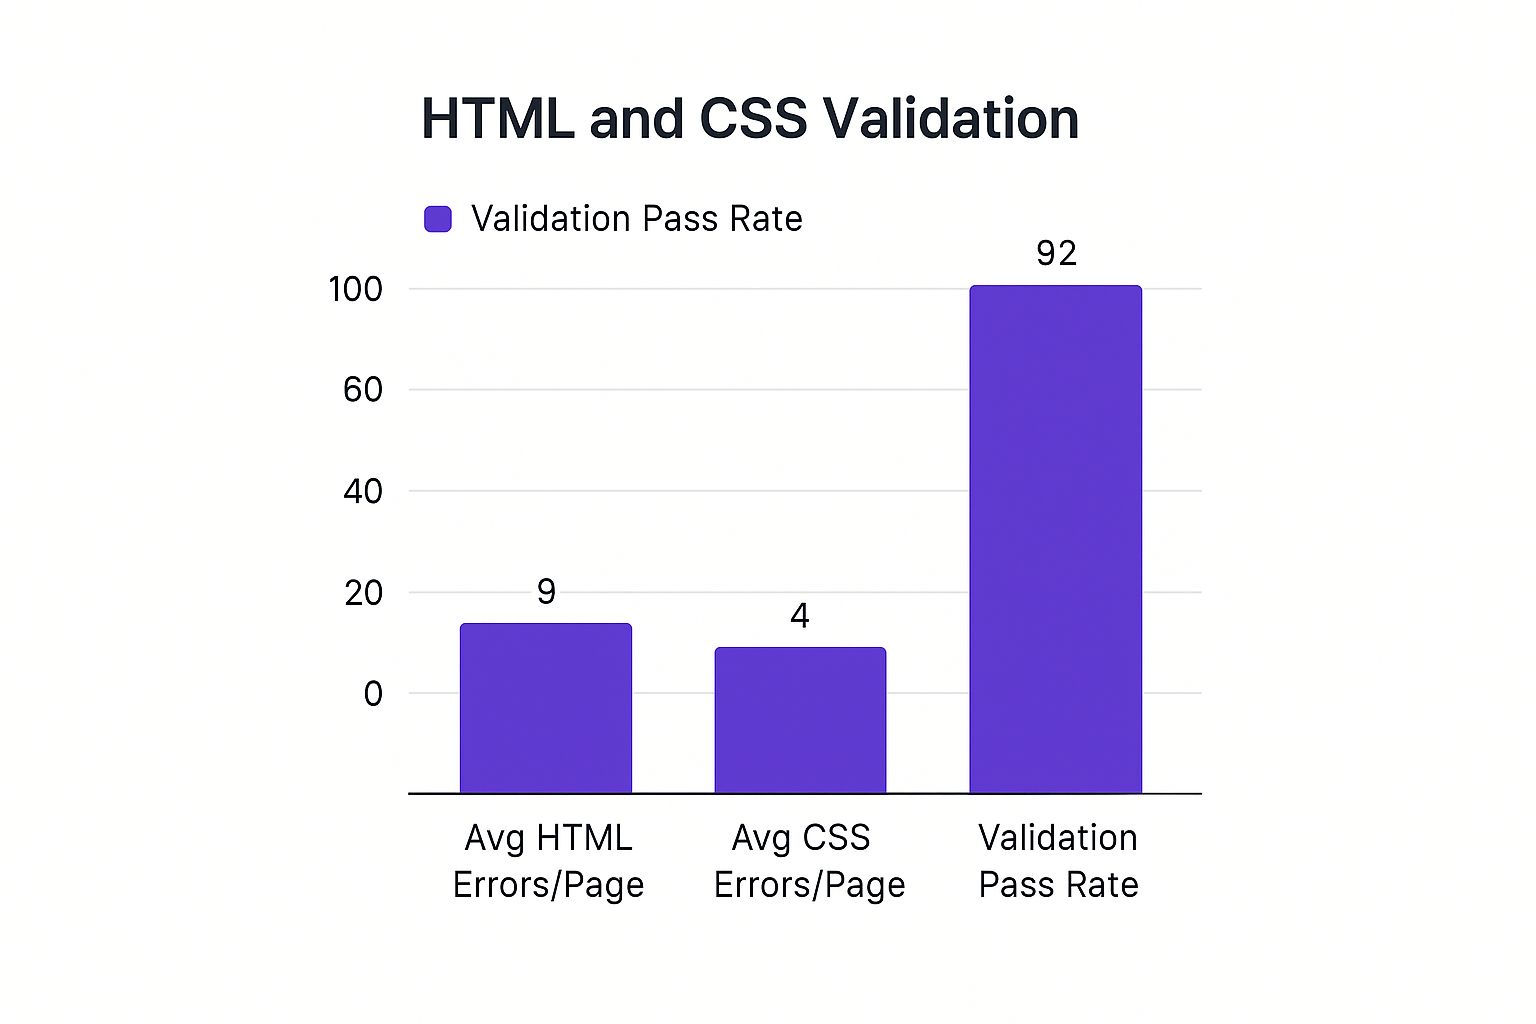
This data proves that code validation is often swept under the rug, yet it’s the very foundation of your site's performance and accessibility. Making this a regular part of your maintenance routine is key to ensuring a stable, reliable experience for every single visitor.
Using Advanced Tools for a Deeper Website Audit
Browser developer tools are fantastic for quick spot-checks, but at some point, you need to bring in the heavy machinery. For a truly deep and comprehensive website audit, advanced third-party tools are your best friends. These platforms are built to systematically crawl your entire site, uncovering issues that would be nearly impossible to find by hand.
These tools don’t just pinpoint one-off problems; they give you a holistic view of your website's health. They map out how pages link together, how search engines actually see your content, and where critical performance bottlenecks are hiding. This level of analysis is crucial when you need to check for website errors at scale, especially on larger sites with hundreds or thousands of pages.

Crawlers and SEO Audit Suites
The workhorses of any serious website audit are SEO crawlers. Tools like Screaming Frog (a desktop application) or cloud-based suites like Semrush and Ahrefs act like your own personal search engine bot. Just feed them your website's URL, and they'll meticulously follow every single link they find, building a complete map of your site's architecture.
As they go, they collect a massive amount of data on each page and flag a huge range of potential problems. Think of them as a team of digital detectives investigating every nook and cranny of your domain.
Here are the kinds of errors these tools are brilliant at finding:
- Broken Links (404s): They will sniff out every single internal and external link that leads to a dead end.
- Redirect Chains: They identify inefficient redirect loops (like Page A pointing to Page B, which then points to Page C) that slow down your site and frustrate search engines.
- Duplicate Content: They can spot pages with identical or nearly identical titles, meta descriptions, or H1 tags—a major red flag for SEO.
- Missing SEO Elements: The crawler will flag any page that’s missing a title tag, meta description, or image alt text.
For instance, after a crawl, a tool might show you that 25% of your blog post images are missing alt text, or that a key service page is being accidentally blocked by your robots.txt file. This is the kind of actionable data that truly moves the needle.
Code Validators and Markup Checkers
Beyond crawling for SEO, it’s vital to make sure your website's code is clean and follows web standards. This is where code validators come in. The most well-known free tool for this is the W3C Markup Validation Service.
You can simply pop in a URL, and this service will analyze the page's HTML, flagging syntax errors, old-school tags, or structural problems. Sure, modern browsers are pretty forgiving of messy code, but validation errors can cause weird rendering issues across different devices. More importantly, they can be a huge barrier to accessibility for users who rely on screen readers. Clean code is the hallmark of a professional, well-maintained website.
A clean bill of health from a code validator means your site is built on a solid foundation. It ensures better cross-browser compatibility, improves accessibility, and makes future maintenance far easier for your development team.
Specialized Tools for WordPress and Divi
When you’re running a site on a specific platform like WordPress with the Divi theme, you can run into a unique class of errors. These often pop up from conflicts between plugins, issues within the theme itself, or problems with how Divi's modules are set up. This is where specialized tools really shine.
Solutions like Divimode plugins are built with an intimate understanding of the Divi ecosystem. They can help you troubleshoot issues that generic crawlers would completely miss. For example, a plugin might help identify JavaScript conflicts caused by another third-party add-on that’s messing with Divi's native functionality. This is a lifesaver for debugging interactive elements like popups or sliders created with Divi Areas Pro.
These specialized tools can also help you zero in on performance issues tied to your server environment. Optimizing your server is a critical step; even the most perfectly built website will feel sluggish on an underpowered host. For a detailed walkthrough, you'll find some great insights in our guide to server performance optimization, which covers key strategies for a faster, more reliable setup.
Ultimately, picking the right tool comes down to your goal. Hunting for broken links? A crawler like Screaming Frog is perfect. Trying to diagnose a bizarre glitch in your Divi mega menu? A platform-specific tool is your best bet. By combining these advanced resources, you get a 360-degree view of your site's health, empowering you to fix not just the symptoms, but the root causes of any error.
Building a Proactive Error Monitoring Routine
The best way to deal with website errors is to catch them long before your customers ever notice. This is all about making a mental shift—from reactive firefighting to proactive fire prevention. Instead of scrambling when your site breaks, you can build a simple, sustainable maintenance habit that fits right into your existing schedule.
This doesn't mean adding another massive task to your to-do list. The goal is to create a repeatable process that acts as an early warning system. Just a few minutes of routine checks can save you from the headache, stress, and cost of extended downtime or a security breach.
Establishing Your Monitoring Cadence
When it comes to site maintenance, consistency beats intensity every time. You don't need to spend hours a day hunting for bugs. The key is to break down your checks into manageable daily, weekly, and monthly tasks to create a steady rhythm.
A fantastic place to start is with automated alerts. Google Search Console is your best friend here. You can configure it to email you the moment it discovers new crawl errors, like a sudden spike in 404s or server issues. Think of this as your frontline defense, catching problems as soon as Google’s bots do.
A proactive monitoring routine transforms website maintenance from a stressful, unpredictable chore into a calm, controlled process. It’s the difference between being an emergency responder and a health inspector.
This preventative approach has never been more vital. As our digital lives grow, so do the threats. By 2025, the global cost of cybercrime is projected to hit a staggering $10.5 trillion annually, positioning it as one of the world's largest economic threats. This number alone underscores the absolute necessity of robust security checks and continuous monitoring to find and fix vulnerabilities before they become costly disasters. You can discover more insights about these growing cyber threats and see exactly why getting ahead of the curve is so critical.
Your Practical Maintenance Checklist
To make this easy to put into practice, here’s a straightforward checklist you can adapt. This framework helps you cover all the critical bases without feeling overwhelmed.
Daily Checks (Less than 5 minutes):
- Visual Homepage Check: Pull up your homepage on both desktop and mobile. Does everything look and work the way it should? A quick visual scan is often all it takes to spot glaring layout issues or a broken hero image.
- Review Automated Alerts: Just glance at your inbox for any critical alerts from Google Search Console, your hosting provider, or any uptime monitoring services you use.
Weekly Checks (15-30 minutes):
- Run a Performance Scan: Use a tool like Google PageSpeed Insights to test your key pages—think homepage, a product page, and a blog post. Keep an eye out for any major dips in your performance scores that might point to a new issue.
- Test Critical User Paths: Put yourself in a customer's shoes. Can you successfully submit your contact form? Can you add a product to the cart and get to the checkout page? This simple simulation is a surprisingly effective way to catch broken functionality.
- Review Google Search Console: Log in and take a look at the "Pages" report for any new indexing errors or warnings. Pay close attention to trends—is the number of "Crawled – currently not indexed" pages suddenly shooting up?
Monthly Checks (1-2 hours):
- Run a Full Site Crawl: Use an SEO crawler for a comprehensive audit. This will catch all broken links (both internal and external), find messy redirect chains, and flag any duplicate content issues.
- Check for Plugin and Theme Updates: Head into your WordPress dashboard and apply any pending security patches or updates for your plugins and theme. Outdated software is one of the most common ways attackers get in.
- Perform a Security Scan: Run a scan with a reputable security plugin to check your site for malware or known vulnerabilities. This is your deep-dive security inspection for the month.
By integrating this simple routine, you turn the chore to check for website errors into a manageable habit. It’s the best way to ensure your digital storefront stays healthy, secure, and ready for business.
Answering Your Top Questions About Website Errors
After digging into the tools and techniques for squashing website errors, you probably still have a few questions buzzing around. That’s perfectly normal. We get asked these all the time by other website owners, so let's tackle them head-on and clear up any lingering confusion.
How Often Should I Check My Website for Errors?
This is one of those "it depends" situations, but I can give you some solid guidelines based on experience. The right frequency really comes down to your site's complexity and how much traffic it gets.
For a busy e-commerce store juggling transactions all day, you'll want to be much more vigilant. A good setup is automated daily checks paired with a hands-on manual review once a week. This way, you can catch anything that might be costing you sales almost as it happens.
On the other hand, if you're running a smaller business site or a personal blog, that pace is probably overkill. A thorough manual check once a month, with automated alerts from Google Search Console filling in the gaps, is a great baseline.
The most important thing isn't the exact schedule, but establishing a consistent, repeatable routine. Pick a rhythm that works for you and stick to it.
Do Minor HTML Errors Actually Hurt My SEO?
Fantastic question, and the answer isn't a simple yes or no. Search engines have gotten incredibly smart at figuring out pages with messy code, but a pile-up of HTML errors can definitely cause indirect problems. Think of them as a form of technical debt that slowly chips away at your rankings.
Here’s how it usually plays out:
- Slower Page Speed: Messy, invalid code makes browsers work harder to render your page, which can slow everything down.
- Accessibility Issues: Validation errors can trip up screen readers, making your site a nightmare for users with disabilities—a factor that search engines are paying more and more attention to.
- Weird Rendering Glitches: A page that looks perfectly fine on your Chrome browser might look completely broken on someone else's, leading to a terrible user experience and a high bounce rate.
So, while a single unclosed <div> tag isn't going to torpedo your website, striving for clean, valid code is always the best bet for your long-term SEO health.
What Is the Real Difference Between a 404 and a 500 Error?
Nailing this distinction is crucial because it tells you exactly where to start looking for a fix. It all comes down to a client-side versus a server-side problem.
A 404 Not Found error is a client-side problem. This means the user's browser successfully connected to your server, but the specific page it asked for just isn't there. It’s usually caused by a broken link, a deleted page, or someone just typing a URL wrong. It's an "oops, that's not here" message.
A 500 Internal Server Error is a much more serious server-side problem. It’s a generic "Houston, we have a problem" message from your server. Something broke on its end, but it can’t tell you exactly what. This is often triggered by a misbehaving plugin, a bad script, or the server running out of memory.
Here's an easy way to remember it: a 404 means "I looked, but couldn't find the page you asked for," while a 500 means "Something broke on my end while I was trying to get your page."
My Website Looks Fine to Me, So Why Do I Need to Check for Errors?
This is a classic trap. Just because your site looks fine on your computer doesn't mean it's actually healthy. The most dangerous errors are often the ones you can't see.
Think about it—your site might load perfectly for you on your super-fast office Wi-Fi, but hidden issues could be crippling the experience for others. You might have a JavaScript conflict that only breaks a critical feature on iPhones, or a security vulnerability that’s completely invisible until it's too late.
Regular checks with the right tools are designed to shine a light on these invisible problems before they become catastrophes. Proactively hunting for these issues is what separates a professionally-maintained website from one that's just a ticking time bomb.
At Divimode, we build tools that make creating and maintaining high-performing Divi websites easier than ever. Whether you need to craft engaging popups with Divi Areas Pro or want to learn more about optimizing your site, we're here to help. Discover Divimode plugins and tutorials today.
More Articles You Will Like