
In today's competitive online space, a slow website is a silent business killer. Seconds, even milliseconds, can mean the difference between a conversion and a bounce. But how do you know if your site is truly fast for every user, on every device, in every location? Guessing isn't a strategy. This is where website performance monitoring tools come in. They are your eyes and ears, providing the critical data needed to diagnose issues before they impact your users and your bottom line.
A high-performing site delivers a consistent experience whether a user is on a desktop or a mobile phone. Ensuring a seamless experience across all devices, optimising your site with responsive design, is crucial for both user satisfaction and search engine rankings. Performance tools help validate that your responsive efforts translate into real-world speed.
This guide moves beyond generic feature lists to provide an actionable roundup of the best website performance monitoring tools available. We will dissect the top platforms, highlighting their specific strengths, ideal use cases, and limitations to help you make an informed choice. Each review includes screenshots and direct links, helping you compare solutions for everything from enterprise-level application monitoring to straightforward uptime checks. We’ll also clarify the two primary monitoring types, Real User Monitoring (RUM) and Synthetic Monitoring, and explain why a combined approach is often the most powerful strategy for achieving peak performance. Let's find the right tool for you.
1. Datadog
Datadog is a comprehensive, full-stack observability platform that provides an integrated view of your entire technology stack. It excels at connecting front-end user experience with back-end application performance, making it a powerful choice for teams needing deep, correlated insights. Among its suite of website performance monitoring tools, its Synthetic Monitoring and Real User Monitoring (RUM) products are standout solutions.
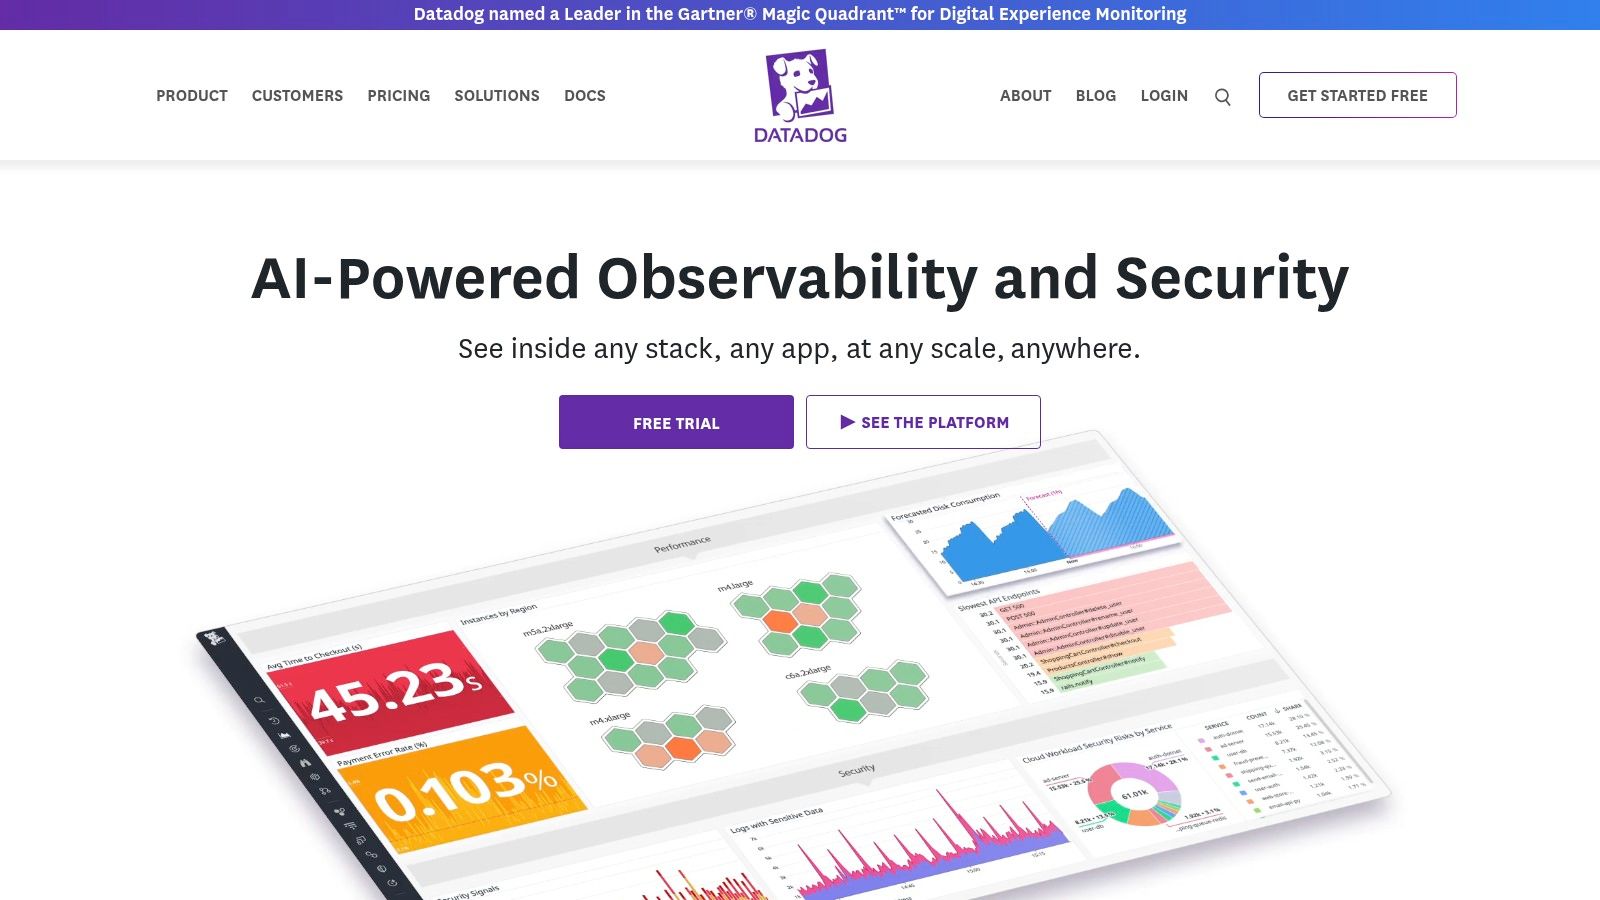
With Datadog, you can proactively test user journeys from global locations using a no-code browser test recorder and analyze real user sessions with detailed performance metrics and error tracking. Its key differentiator is the ability to unify data from RUM, synthetics, logs, and APM traces in a single dashboard, providing a complete picture from a user click all the way down to a specific database query. This makes it ideal for DevOps and SRE teams in complex, cloud-native environments.
Key Details & Pricing
- Primary Use Case: End-to-end monitoring for teams that need to correlate front-end performance with back-end infrastructure and application health.
- Unique Feature: The unified platform allows you to pivot seamlessly between synthetic tests, RUM data, application traces, and infrastructure metrics without switching tools.
- Pricing Model: Datadog uses a granular, usage-based pricing model. Synthetic API tests start at $7 per 10,000 runs, and Browser tests at $18 per 1,000 runs. RUM starts at $2.20 per 1,000 sessions per month.
- Pros: Mature platform with extensive integrations; powerful correlation capabilities.
- Cons: Costs can escalate quickly without careful monitoring and governance.
Website: https://www.datadoghq.com
2. New Relic Web Performance Monitoring
New Relic provides an accessible entry point into enterprise-grade observability with its dedicated web performance monitoring tools. It’s designed for teams who need a quick, plug-and-play solution for uptime and Core Web Vitals tracking, with the option to scale into a full-stack monitoring platform as their needs grow. The platform automates synthetic checks from multiple locations and offers clear dashboarding on key user experience metrics.
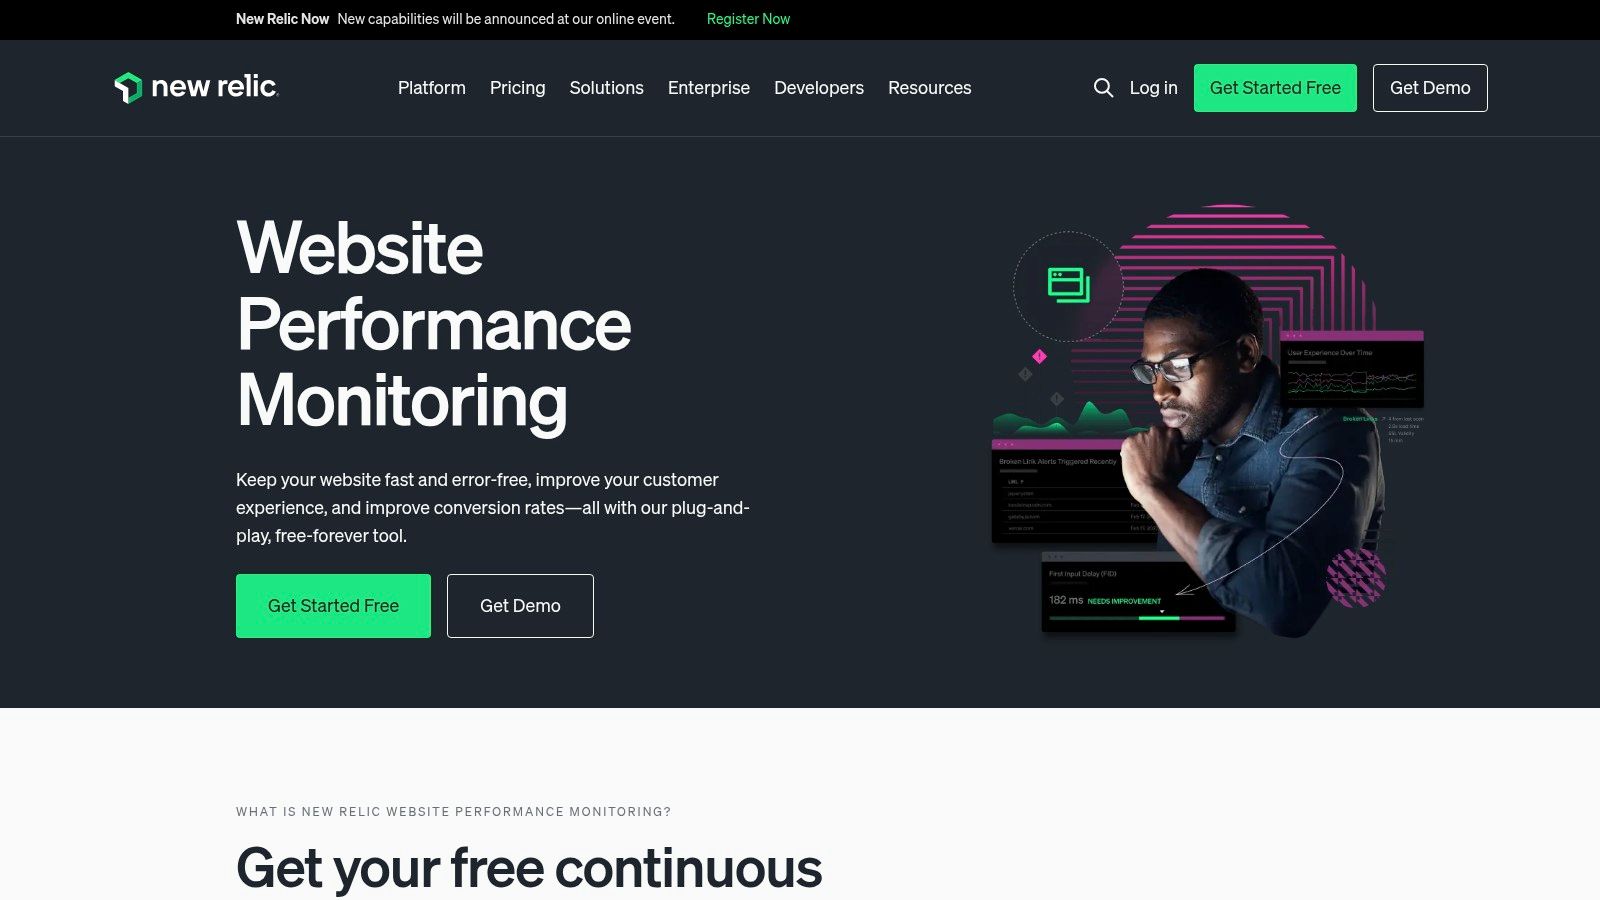
New Relic excels at simplifying initial setup and providing immediate value. Its built-in Core Web Vitals dashboards not only display metrics but also offer actionable guidance for improvement, a valuable feature for teams without deep performance expertise. The key differentiator is its generous free tier, which allows users to implement robust synthetic monitoring without an initial investment. This makes it a great choice for startups or smaller teams who want powerful features that can expand into New Relic's broader APM and infrastructure monitoring ecosystem.
Key Details & Pricing
- Primary Use Case: Quick-start synthetic monitoring and Core Web Vitals analysis, with a clear path to full-stack observability.
- Unique Feature: A perpetual free tier that includes 500 synthetic check runs per month, making powerful uptime monitoring accessible to everyone.
- Pricing Model: Offers a free tier with no credit card required. Paid plans are user-based, starting with a Standard plan and custom Pro/Enterprise pricing for more advanced features.
- Pros: Generous free tier for getting started; simple setup that can scale into a comprehensive observability platform.
- Cons: Advanced features in Pro plans are priced per-user, which can become costly for larger teams.
Website: https://newrelic.com/platform/web-performance-monitoring
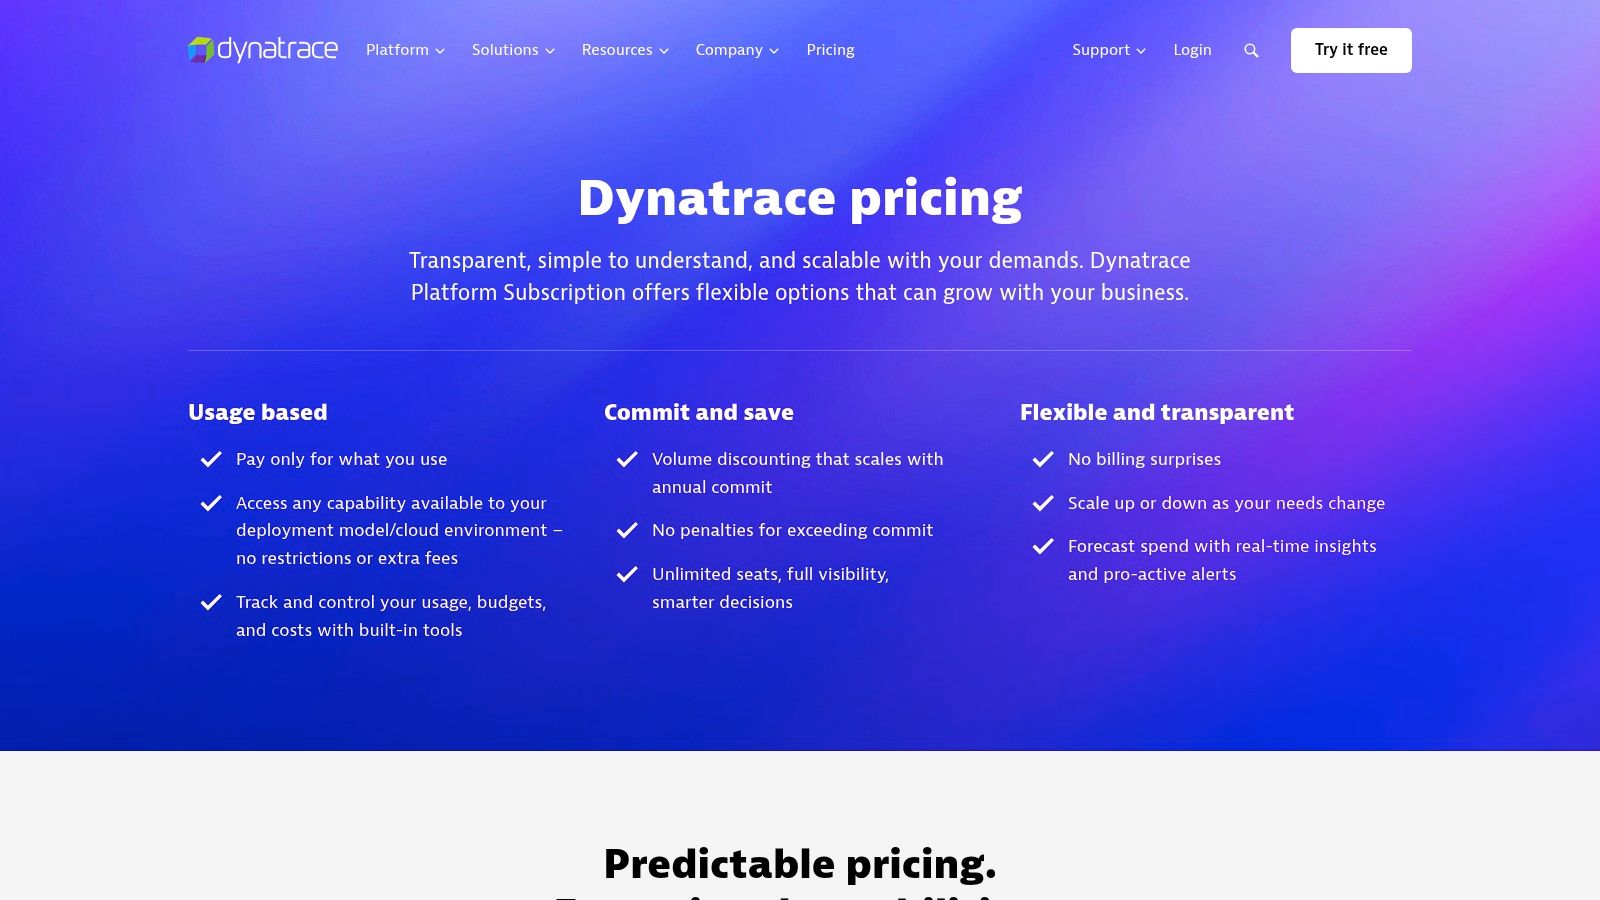
3. Dynatrace
Dynatrace is an enterprise-grade observability platform known for its powerful AI engine, Davis, which provides automatic and intelligent analysis across the full stack. Its Digital Experience Monitoring (DEM) capabilities are deeply integrated, combining Real User Monitoring (RUM), session replay, and synthetic monitoring to offer a complete view of website performance and user behavior.
The platform excels at connecting front-end user interactions with back-end application performance and infrastructure health, all analyzed by its AI. This makes Dynatrace one of the most effective website performance monitoring tools for identifying the root cause of complex issues without manual effort. Its ability to automatically detect anomalies and map dependencies is a significant advantage for large organizations managing intricate digital ecosystems.
Key Details & Pricing
- Primary Use Case: Full-stack, AI-assisted observability for large enterprises needing to automate root-cause analysis across digital experiences, applications, and infrastructure.
- Unique Feature: The Davis AI engine automatically analyzes billions of data points to provide precise answers and actionable insights, significantly reducing manual troubleshooting time.
- Pricing Model: Dynatrace offers a transparent rate card. For example, RUM is priced based on sessions, and Synthetic Monitoring is priced per request or browser check, with clear volume-based tiers.
- Pros: Powerful AI-assisted problem detection; comprehensive DEM and APM capabilities; clear, detailed pricing.
- Cons: Enterprise-focused offering can be overly complex and costly for smaller websites or teams.
Website: https://www.dynatrace.com/pricing/
4. SolarWinds Pingdom
SolarWinds Pingdom is a long-standing and widely recognized name in the website monitoring space, celebrated for its straightforward approach to uptime and synthetic performance testing. It is particularly popular with marketing, web development, and operations teams who need clear, actionable insights into website availability and page load times without the complexity of a full-stack observability platform. Pingdom excels at providing easy-to-understand reports and alerts for key user-facing metrics.
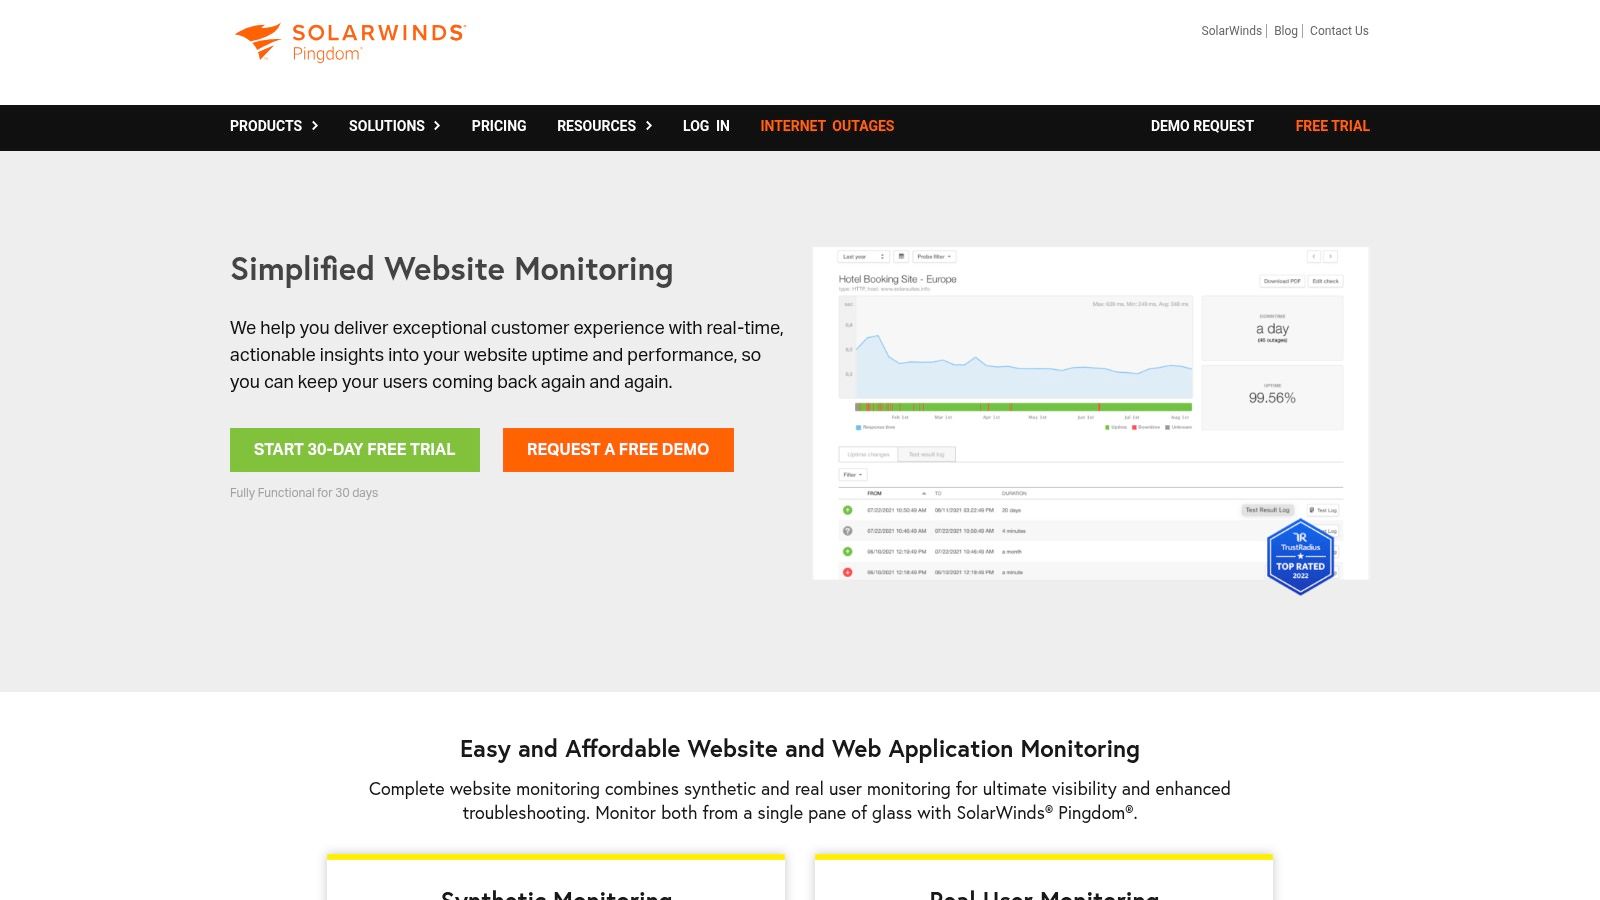
With Pingdom, users can quickly set up uptime checks, detailed page speed tests, and transaction monitoring to simulate critical user journeys like sign-ups or checkouts. Its key differentiator is its simplicity and focus; it does a few things exceptionally well, making it one of the most accessible website performance monitoring tools for non-specialists. The platform also offers optional Real User Monitoring (RUM) to complement its synthetic checks, providing a more complete picture of actual visitor experiences.
Key Details & Pricing
- Primary Use Case: Uptime, synthetic page speed, and transaction monitoring for marketing sites, e-commerce stores, and business-critical web applications.
- Unique Feature: Its intuitive interface and shareable public status pages make it easy to communicate website health to both technical and non-technical stakeholders.
- Pricing Model: Offers both synthetic and RUM monitoring, priced separately. Synthetic Monitoring starts at $15/month for 10 uptime checks. RUM starts at $15/month for 100,000 pageviews. A 14-day free trial is available.
- Pros: Very straightforward setup and a well-known, trusted tool for core web performance use cases; flexible plan configurator.
- Cons: Pricing calculator can be opaque until you configure a plan; advanced analysis may require higher-tier plans or different tools.
Website: https://www.pingdom.com
5. SpeedCurve
SpeedCurve is a specialized front-end performance monitoring platform designed to connect website speed with business outcomes. It powerfully combines synthetic testing with Real User Monitoring (RUM) data, focusing heavily on user-centric metrics like Core Web Vitals and providing tools like performance budgets to help teams stay on track. Its strength lies in its intuitive visualizations that make complex performance data accessible to developers, designers, and marketers alike.
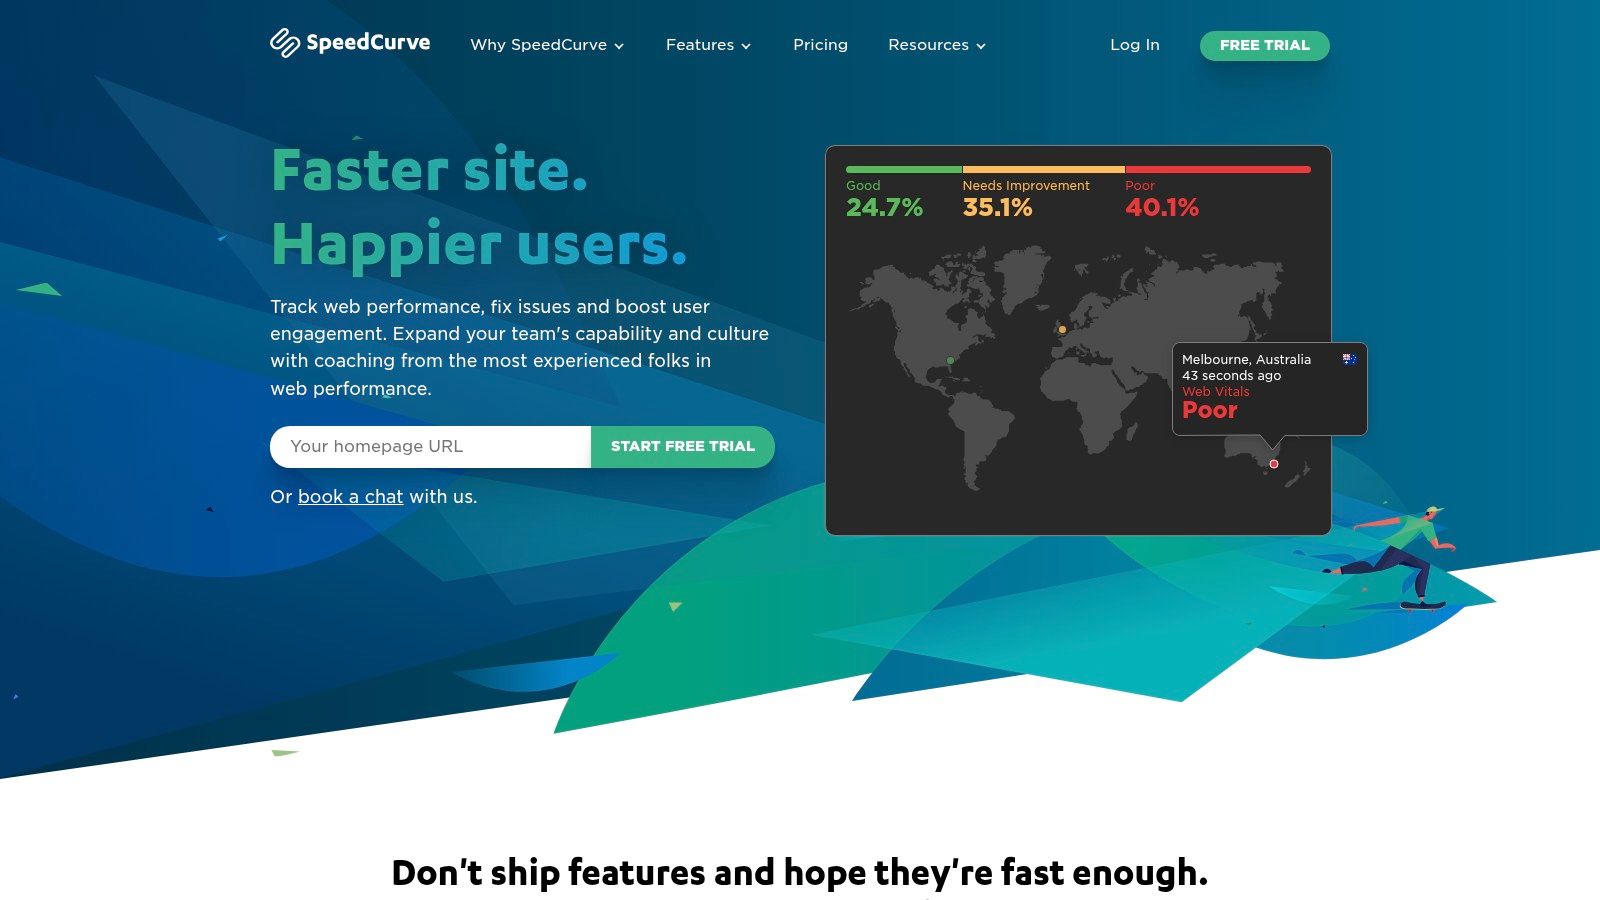
Unlike full-stack observability platforms, SpeedCurve is laser-focused on the user experience. It helps teams understand how rendering performance and asset loading impact user engagement and conversion rates. This makes it an excellent choice for front-end development teams, UX designers, and e-commerce managers who need to justify performance work with tangible business metrics. For those looking to improve these metrics, SpeedCurve provides actionable insights that can guide efforts toward decreasing website loading time.
Key Details & Pricing
- Primary Use Case: Front-end performance analysis for teams aiming to optimize user experience and connect speed improvements to business KPIs.
- Unique Feature: The "performance budgets" feature allows you to set thresholds for metrics like Lighthouse scores or loading times, sending alerts when they are exceeded.
- Pricing Model: Plans are built based on the volume of RUM pageviews and synthetic checks. Pricing starts at $224/month for 100,000 RUM pageviews and 5,000 synthetic checks.
- Pros: Excellent UI for visualizing performance impact; strong focus on Core Web Vitals and user-centric metrics.
- Cons: Higher entry price than some competitors; less suited for deep back-end or infrastructure monitoring.
Website: https://www.speedcurve.com
6. Uptrends
Uptrends specializes in synthetic monitoring, offering a robust suite of tools to proactively test websites, APIs, and complex user transactions from a global perspective. It is designed for teams who need reliable uptime and performance data without the complexity of a full-stack observability platform, focusing instead on delivering detailed, actionable insights from controlled test environments. Its large network of checkpoints makes it a strong contender for businesses needing to validate performance across diverse geographic regions.
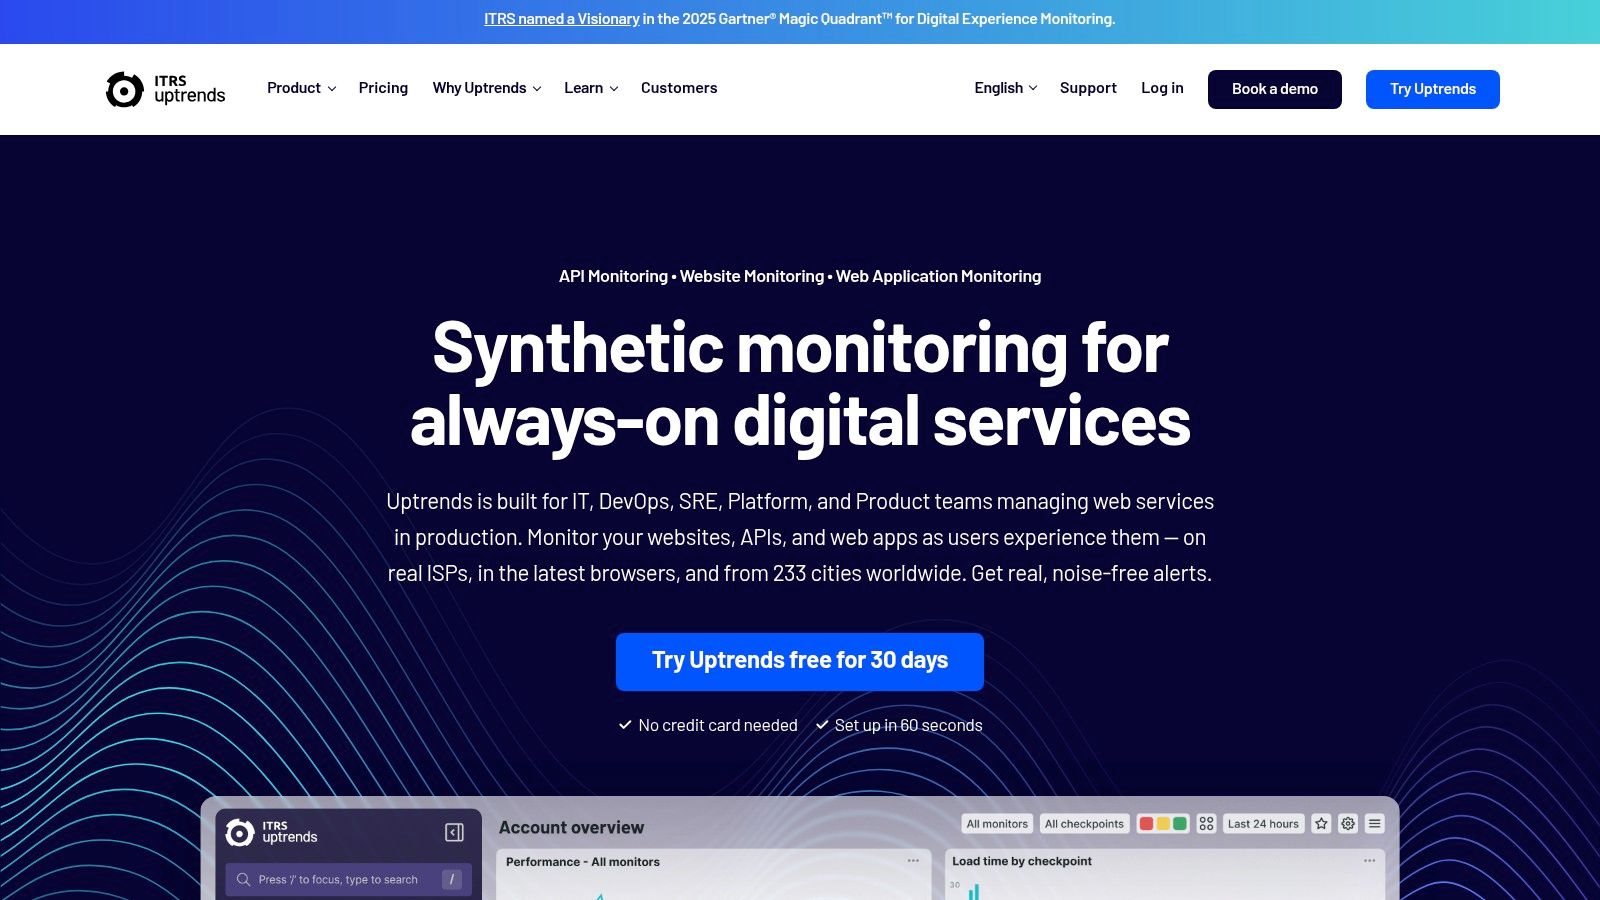
The platform provides multi-step transaction monitoring using a recorder, simplifying the process of simulating user journeys like login flows or checkout processes. Browser-based tests come with detailed waterfall charts and filmstrip recordings, helping pinpoint exactly where slowdowns occur. This clear separation of API, browser, and basic uptime checks makes Uptrends one of the more straightforward website performance monitoring tools for teams that prefer a modular, pay-for-what-you-need approach to monitoring.
Key Details & Pricing
- Primary Use Case: Synthetic monitoring of website uptime, API availability, and critical user transaction performance from a vast global network.
- Unique Feature: An extensive network of 233 global checkpoints combined with a flexible, credit-based pricing model that allows users to build a custom monitoring plan.
- Pricing Model: Uptrends uses a credit-based subscription model. For example, the Starter plan at $21.25/month includes 10 uptime monitors. More advanced plans offer more features and credits. A 30-day free trial is available.
- Pros: Modular pricing lets you pay only for required capabilities; large global checkpoint network and clear feature separation.
- Cons: The credit-based model can introduce a learning curve for budgeting and requires planning to map credits to specific monitoring needs.
Website: https://www.uptrends.com
7. Catchpoint
Catchpoint is an enterprise-grade Internet Performance Monitoring platform that provides deep visibility into every layer of the digital experience. It excels at monitoring complex web applications, APIs, DNS, and CDNs from a user's perspective, leveraging one of the largest and most diverse global agent networks available. This makes it an essential tool for global brands that need to understand performance variations across different geographies, ISPs, and last-mile networks.
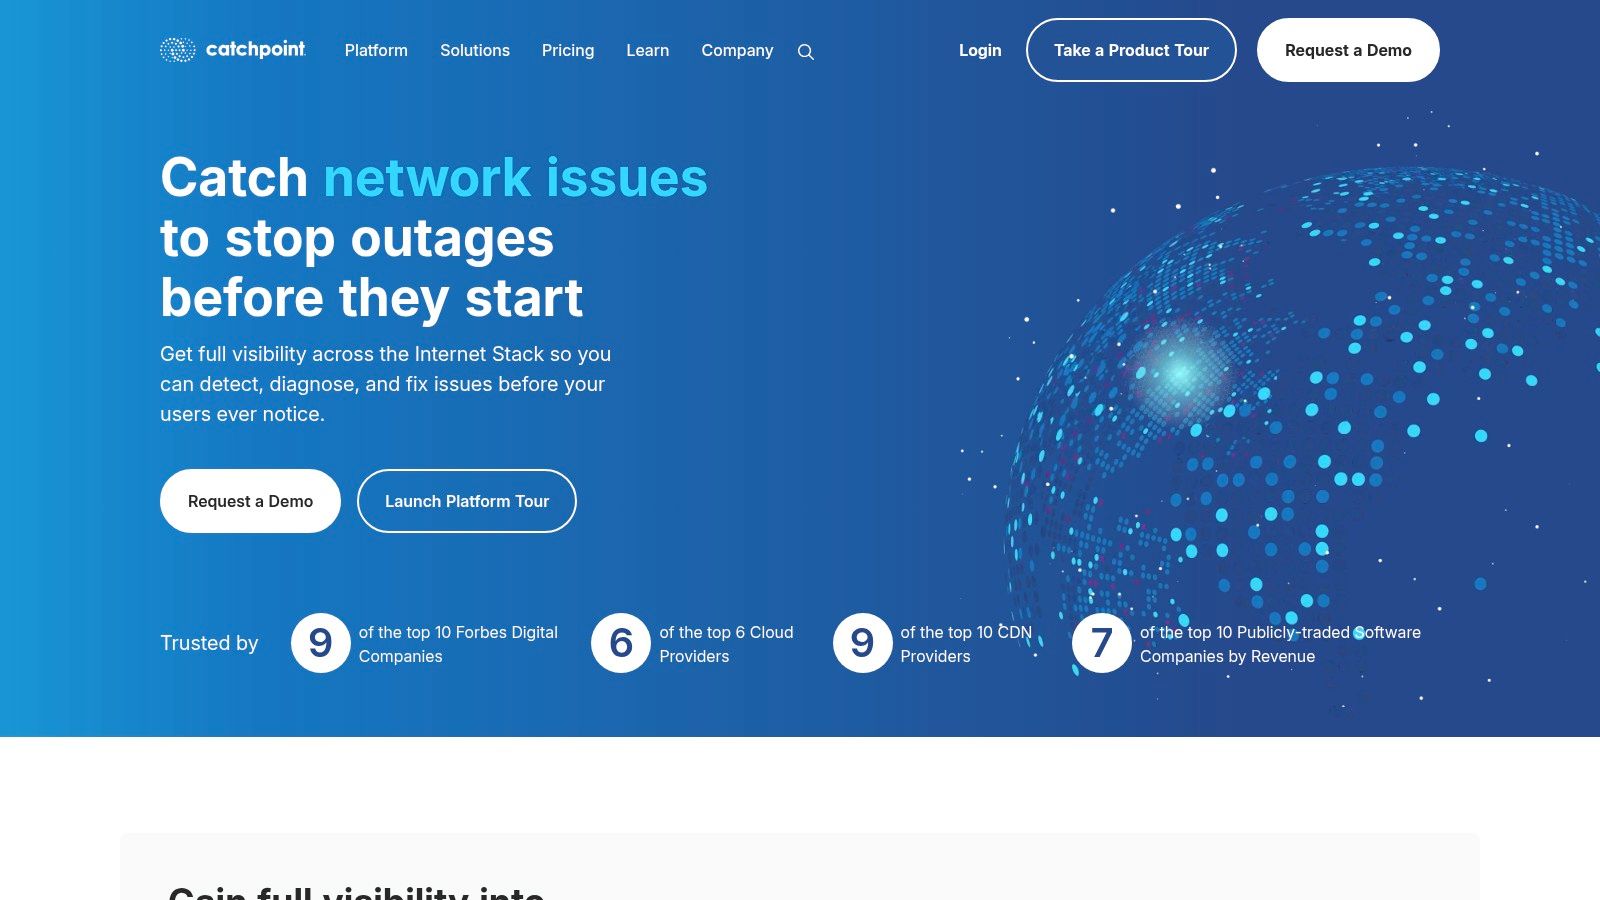
The platform's key differentiator is its extensive network of backbone, last-mile, cloud, and wireless monitoring agents, offering unparalleled geographic coverage. This allows teams to precisely replicate and diagnose user-facing issues that other website performance monitoring tools might miss. With a generous default data retention of three years and flexible, points-based pricing that includes unlimited users, Catchpoint is built for large-scale, long-term performance analysis, providing the granular data needed to hold third-party vendors accountable and optimize global delivery.
Key Details & Pricing
- Primary Use Case: Global synthetic monitoring for large enterprises needing to diagnose complex performance issues across diverse networks and third-party services.
- Unique Feature: An expansive and diverse global network of monitoring agents (backbone, last-mile, cloud, wireless) provides unmatched visibility.
- Pricing Model: A points-based model with various tiers, including a Free Starter plan. Enterprise plans can start around $10,000/year, offering flexibility for different monitoring needs.
- Pros: Powerful diagnostics for distributed digital footprints; long data retention is standard.
- Cons: Can be overly complex and expensive for smaller websites or simple projects.
Website: https://www.catchpoint.com
8. Sematext Cloud (Synthetics + Experience)
Sematext Cloud offers a unified observability suite designed to be both powerful and cost-effective, particularly for small to mid-size teams. Its website performance monitoring tools, Synthetics and Experience (RUM), provide a comprehensive view of user-facing performance by combining proactive uptime checks with real-time user session data. This allows teams to monitor key business transactions, track web vitals, and quickly identify performance bottlenecks affecting their end-users.

The key advantage of Sematext is its predictable pricing and its ability to consolidate monitoring into a single platform. Instead of just focusing on web performance, it integrates logs, infrastructure metrics, and APM, enabling teams to correlate front-end issues with back-end behavior without managing multiple vendors. This makes it an excellent choice for organizations looking for a comprehensive monitoring solution that is straightforward to implement and won’t lead to surprise bills.
Key Details & Pricing
- Primary Use Case: All-in-one observability for teams wanting to combine website performance monitoring with logs, metrics, and APM in a single, cost-predictable platform.
- Unique Feature: The combination of a unified platform with a very transparent, per-monitor pricing model that is easy to understand and budget for.
- Pricing Model: Offers pay-as-you-go plans. Synthetics monitors start from $2 per HTTP monitor and $7 per Browser monitor. Experience (RUM) starts at $9 per month for 25,000 page views.
- Pros: Very competitive and easy-to-estimate pricing; a truly unified platform that covers more than just web performance.
- Cons: The ecosystem and number of integrations may be smaller compared to larger, enterprise-focused observability vendors.
Website: https://sematext.com
9. GTmetrix
GTmetrix is a widely recognized and accessible lab testing tool that focuses specifically on page-level performance analysis. It simplifies the process of understanding how quickly your pages load and provides actionable recommendations based on Google's Core Web Vitals and its proprietary GTmetrix Grade. It excels at scheduled monitoring, allowing you to automatically test key pages on a daily, weekly, or monthly basis and receive alerts when performance degrades.
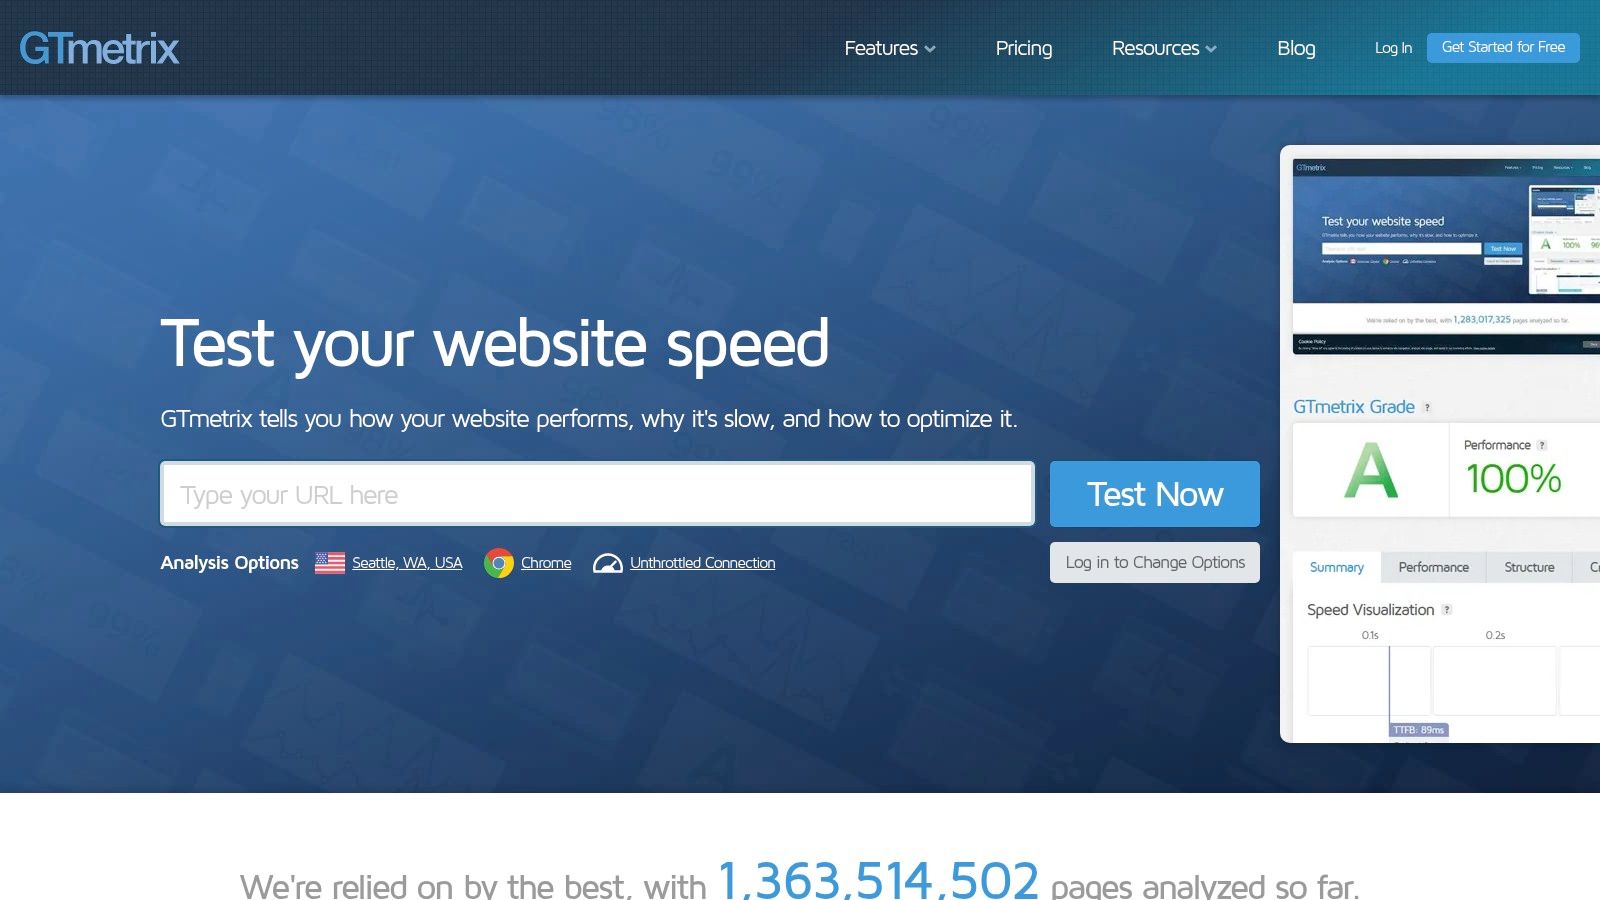
The platform's key strength lies in its detailed waterfall charts, filmstrips, and historical data graphs, which make it easy for developers and marketers alike to visualize loading behavior and pinpoint specific issues. While it isn't a full-stack observability platform, it is one of the best website performance monitoring tools for teams focused on front-end optimization and tracking the impact of code changes over time. Many developers use its reports to learn how to improve their website performance.
Key Details & Pricing
- Primary Use Case: Scheduled, on-demand analysis of individual page speed with detailed diagnostics for front-end optimization.
- Unique Feature: The combination of Lighthouse metrics with a custom GTmetrix Grade and historical filmstrip comparisons provides a clear, visual way to track page-level changes.
- Pricing Model: Offers a generous free plan for basic analysis. Paid plans start at $10.67/month for more frequent monitoring, premium global test locations, and advanced features.
- Pros: Very user-friendly with an affordable entry point; excellent visualizations for diagnosing front-end bottlenecks.
- Cons: Purely a lab testing tool, not a RUM or APM solution; advanced features and test locations require a paid subscription.
Website: https://gtmetrix.com
10. Site24x7
Site24x7, a product from Zoho Corporation, is an all-in-one SaaS monitoring solution offering a powerful suite of website performance monitoring tools at a very competitive price point. It covers website uptime, synthetic transaction monitoring, and Real User Monitoring (RUM), with seamless options to expand into full-stack infrastructure and application performance monitoring (APM). This makes it an excellent choice for small to mid-market teams looking for a scalable, feature-rich platform without a high initial cost.
The platform allows you to monitor availability and response times from over 130 global locations and simulate multi-step user journeys to ensure critical workflows are functioning correctly. A key advantage is its value proposition; core plans often include a generous allocation of RUM pageviews and basic monitors. For those managing CMS-based sites, understanding how monitoring data can guide improvements is crucial, and you can learn more about how to optimize WordPress speed to complement these efforts. Site24x7 provides a holistic view that combines synthetic tests with real user data for a complete performance picture.
Key Details & Pricing
- Primary Use Case: All-in-one monitoring for SMBs and mid-market companies needing website, server, and application monitoring in a single, cost-effective platform.
- Unique Feature: The inclusion of RUM, synthetic monitoring, and server monitoring within its standard plans offers exceptional value compared to many competitors.
- Pricing Model: Offers a free-forever tier. Paid plans are subscription-based, starting from $9/month (billed annually), with flexible add-ons for extra monitors, RUM pageviews, and APM.
- Pros: Very feature-rich for the price; easy to expand from website monitoring into full-stack APM and infrastructure.
- Cons: The pricing page is dense, and understanding the mapping of monitors and credits can be confusing initially.
Website: https://www.site24x7.com
11. Cloudflare Observatory & Synthetic Monitoring
For websites already leveraging Cloudflare's network, Observatory and Synthetic Monitoring offer an incredibly convenient and integrated solution. This suite of website performance monitoring tools provides on-demand, Lighthouse-based synthetic tests and real user monitoring (RUM) insights directly within the Cloudflare dashboard, eliminating the need for a separate third-party service for basic performance checks.
Cloudflare's key advantage is its ability to connect performance data directly to its network services. You can view edge-to-origin telemetry alongside core web metrics, offering a unique perspective on how your CDN configuration impacts user experience. Furthermore, its "Smart Shield" recommendations provide one-click optimizations, making it simple to act on the performance data you collect. This tight integration makes it an excellent starting point for any team whose traffic is proxied through Cloudflare.
Key Details & Pricing
- Primary Use Case: Quick, integrated performance monitoring for websites using Cloudflare's CDN, DNS, or other network services.
- Unique Feature: Combines performance monitoring with actionable, one-click "Smart Shield" optimizations that directly adjust your Cloudflare settings.
- Pricing Model: A generous number of tests and RUM pageviews are included with Cloudflare plans, even the Free tier. Paid plans offer higher quotas and more frequent testing capabilities.
- Pros: Seamless integration for existing Cloudflare users with zero setup; combines monitoring with actionable network-level fixes.
- Cons: Primarily valuable for sites proxied through Cloudflare; advanced features and test quotas are limited by plan tier.
Website: https://dash.cloudflare.com
12. Amazon CloudWatch Synthetics (AWS)
Amazon CloudWatch Synthetics is a native AWS service designed for teams deeply embedded in the Amazon Web Services ecosystem. It allows you to create configurable scripts, called "canaries," to monitor your application endpoints and API availability around the clock. These canaries simulate user traffic, continuously verifying your customer experience even when there is no real traffic, making it a key part of the website performance monitoring tools available on AWS.
The primary advantage of CloudWatch Synthetics is its seamless integration with other AWS services like CloudWatch for metrics, EventBridge for automated actions, and IAM for security. You can easily set up alerts based on canary failures and dive into detailed troubleshooting artifacts, including screenshots, HAR files, and logs, which are stored in S3. This tight coupling simplifies monitoring for organizations that have standardized their infrastructure and billing on AWS, eliminating the need for a separate third-party tool.
Key Details & Pricing
- Primary Use Case: Proactive monitoring of web endpoints and API availability for applications running primarily on AWS infrastructure.
- Unique Feature: Tight, native integration with the AWS ecosystem, allowing for unified billing, security (IAM), and event-driven automation via services like EventBridge.
- Pricing Model: Pay-per-run pricing, which varies by region. A free tier includes 100 canary runs per month. Note that costs for related services like Lambda, S3, and CloudWatch Logs are billed separately.
- Pros: Excellent for AWS-centric environments; good artifact retention for troubleshooting.
- Cons: Total cost can be complex to calculate as it involves ancillary AWS service usage.
Website: https://aws.amazon.com/cloudwatch/synthetics/
Top 12 Website Performance Monitoring Tools — Feature Comparison
| Product | Core features | Quality (★) | Price & value (💰) | Target audience (👥) | Standout (✨ / 🏆) |
|---|---|---|---|---|---|
| Datadog | Synthetics (API/browser/mobile), RUM, APM, unified dashboards | ★★★★★ | 💰💰💰💰 — usage‑based, can scale high | 👥 DevOps/SREs, large cloud teams | ✨End‑to‑end frontend→backend correlation · 🏆Extensive integrations |
| New Relic Web Performance | Multi‑location synthetics, Core Web Vitals, RUM integration | ★★★★ | 💰💰 — generous free tier, Pro adds per‑user cost | 👥 Dev teams & growing orgs | ✨CWV guidance + easy on‑ramp · 🏆Free tier |
| Dynatrace | RUM, session replay, synthetics, APM with Davis AI | ★★★★★ | 💰💰💰💰 — enterprise pricing | 👥 Enterprise SRE/APM teams | ✨AI‑assisted root‑cause (Davis) · 🏆Comprehensive DEM+APM |
| SolarWinds Pingdom | Uptime, synthetic page speed, transaction checks, optional RUM | ★★★★ | 💰💰💰 — mid pricing, flexible plans | 👥 Marketing/web teams, SMBs | ✨Shareable status pages & simple setup · 🏆Widely used for uptime |
| SpeedCurve | RUM + synthetics, Core Web Vitals focus, performance budgets | ★★★★★ | 💰💰💰 — higher entry for front‑end focus | 👥 Front‑end/performance teams | ✨CWV + business‑impact visualizations · 🏆Great UI for UX→metrics |
| Uptrends | Multi‑step transactions, global checkpoints, filmstrips | ★★★★ | 💰💰 — modular credit model | 👥 Ops/QA needing global checks | ✨233 locations & private agents · 🏆Pay‑for‑what‑you‑need model |
| Catchpoint | Global backbone + last‑mile agents, long retention, point model | ★★★★★ | 💰💰💰💰 — enterprise pricing (high entry) | 👥 Large enterprises, global networks | ✨Last‑mile + 3‑yr retention by default · 🏆Enterprise diagnostics |
| Sematext Cloud | Synthetics + RUM + logs/metrics/APM, pay‑as‑you‑go | ★★★★ | 💰💰 — predictable per‑monitor pricing | 👥 SMBs & mid‑size dev teams | ✨Unified observability + clear pricing · 🏆Cost‑predictable plans |
| GTmetrix | Lab tests, scheduled monitoring, waterfalls, filmstrip visuals | ★★★ | 💰 — very affordable entry | 👥 Designers, SEOs, small agencies | ✨Filmstrips & white‑label reports · 🏆Easy for non‑engineers |
| Site24x7 | Uptime, transactions, RUM, infra & APM add‑ons (Zoho) | ★★★★ | 💰💰 — strong value, flexible add‑ons | 👥 SMBs & mid‑market IT ops | ✨Broad protocol coverage + free‑forever tier · 🏆All‑in‑one value |
| Cloudflare Observatory & Synthetic | Lighthouse‑based synths, RUM‑style metrics, edge telemetry | ★★★★ | 💰 — included in Cloudflare plans (incl. Free) | 👥 Sites using Cloudflare CDN/DNS | ✨Smart Shield optimizations + edge telemetry · 🏆Fast time‑to‑value if proxied |
| Amazon CloudWatch Synthetics | Canary scripts, screenshots/HAR, CloudWatch/EventBridge integration | ★★★★ | 💰💰 — pay‑per‑run + ancillary AWS costs | 👥 AWS‑centric engineers & infra teams | ✨Canaries with artifacts + tight AWS integration · 🏆Consolidated billing/IAM integration |
Choosing the Right Tool for Your Performance Goals
Navigating the landscape of website performance monitoring tools can feel overwhelming, but the right choice ultimately hinges on your unique context. This comprehensive list, from enterprise-grade platforms like Datadog and Dynatrace to user-experience focused solutions like SpeedCurve and accessible options like GTmetrix, demonstrates that there is no single "best" tool. Instead, the optimal solution is the one that aligns with your specific technical stack, business objectives, and team expertise.
For a freelancer managing several Divi client sites, a tool like SolarWinds Pingdom or Uptrends provides a cost-effective way to manage uptime and basic performance checks across multiple domains. An e-commerce manager running a high-traffic WooCommerce store, however, will need deeper insights. They might combine GTmetrix for detailed waterfall analysis of slow-loading product pages with a Real User Monitoring (RUM) solution like Sematext Experience to understand how actual customers are interacting with their checkout process.
Finding Your Perfect Fit
The key is to move beyond feature lists and focus on the actionable data a tool provides. Selecting the right website performance monitoring tool is a strategic decision. Consider these final factors before you commit:
- Primary Goal: Are you focused on uptime (availability monitoring), backend performance (APM), or frontend user experience (RUM and synthetic testing)? Your primary goal dictates the type of tool you need.
- Team Skillset: Do you have a dedicated DevOps team that can leverage the complex, code-level diagnostics of a tool like New Relic? Or do you need a more user-friendly interface like Site24x7 that provides clear, actionable alerts without requiring deep technical knowledge?
- Integration Needs: How well does the tool integrate with your existing workflow? Consider integrations with Slack for alerts, Jira for issue tracking, or CI/CD pipelines for automated testing.
- Scalability: Choose a tool that can grow with you. A startup might begin with the free tier of Cloudflare Observatory, but will it meet their needs when they scale to millions of users?
Many of the tools listed are part of a broader suite of observability products. If your needs extend beyond frontend monitoring to server-side issues, your selection process becomes more complex. To further aid in selecting the ideal solution for your needs, delve into a detailed application performance monitoring tools comparison to understand how these platforms handle backend diagnostics.
Ultimately, the most powerful insights come from implementing a tool and seeing the data for yourself. Take advantage of the free trials offered by nearly every provider on this list. Set up a few key transaction monitors, analyze your Core Web Vitals, and see which platform gives you the clearest path to a faster, more reliable website. Your users, and your bottom line, will thank you.
A fast website is only part of the equation. To truly elevate your Divi projects, you need powerful, performance-optimized modules and layouts. Divimode provides a suite of premium Divi plugins and child themes designed to enhance functionality without sacrificing speed. Explore our products at Divimode and build faster, more engaging websites today.
More Articles You Will Like