
You can't fix what you don't measure. That old saying is the gospel of server performance optimization. Before you even think about tweaking a single setting or installing a caching plugin, you have to know where you stand. This first step is all about establishing your performance baseline—a snapshot of your server’s health that will guide every decision you make.
Think of it like a checkup for your server. Without it, you're just guessing. You'll have no real way of knowing if the changes you make are helping, hurting, or doing absolutely nothing at all. This initial assessment isn't just about speed; it's about building a stable foundation so you can spot and fix problems before they ever impact your users.
Establishing Your Performance Baseline
The goal here is to gather data that gives you a clear picture of your server's "vital signs." This baseline becomes your single source of truth, the "before" photo you'll compare everything against.
Key Server Performance Metrics to Monitor
To get started, you don't need to track every metric under the sun. Focus on the big four that tell the most important stories about your server's health. These are the indicators that will signal trouble long before your site actually feels slow to a visitor.
Here’s a quick rundown of the essential metrics I always check first and what they mean in plain English.
Key Server Performance Metrics to Monitor
| Metric | What It Measures | Ideal State / Red Flag |
|---|---|---|
| CPU Load | The processing power currently being used. | Ideal: Consistently below 75%. Red Flag: Sustained spikes above 80-90% often mean an overloaded server. |
| Memory Usage | The amount of RAM being consumed by processes. | Ideal: Stable usage with plenty of free memory. Red Flag: Constantly high usage or dipping into swap memory. |
| Disk I/O Wait | The time the CPU waits for the hard drive. | Ideal: As close to 0% as possible. Red Flag: High I/O wait points to slow disks or bad database queries. |
| Network Throughput | The amount of data moving in and out. | Ideal: Smooth, predictable traffic patterns. Red Flag: Sudden drops or maxing out bandwidth can signal network issues. |
Monitoring these metrics isn't just about looking at numbers; it's about spotting patterns. For instance, sustained CPU usage above 80% is a classic sign of an overloaded server, which will inevitably lead to slower response times. On the flip side, if your usage is always super low, you might be overpaying for a server you don't need. You can find a deeper dive into how statistical analysis helps with this on KDnuggets.
Visualizing this data makes those patterns even clearer. This chart shows exactly how different metrics can be connected.

See how a spike in network traffic can cause a ripple effect, increasing both CPU and memory usage? This is how you start connecting cause and effect, moving from just observing data to actually understanding what it means for your Divi site.
Pro Tip: Context is everything. Don't panic over a brief CPU spike during your nightly backup—that's completely normal. A sustained, unexplained CPU spike during your slowest traffic hours, however? That's a red flag you need to investigate immediately.
By gathering and looking at this data over a few days, you'll build a reliable baseline. From this point forward, every optimization you make can be measured against this starting point, giving you concrete proof of your success.
Once you’ve pinpointed your server’s weaknesses, caching becomes your single most effective tool for shoring them up. Real server performance optimization is all about making your server do as little work as possible. The best way to do that? A smart, multi-layered caching strategy that serves content to users almost instantly, without constantly hitting your server’s resources.
Think of caching as creating pre-built, ready-to-go copies of your website's content. Instead of your server having to assemble a page from scratch every time a new visitor arrives, it can just hand over a finished version. This is incredibly efficient and takes a massive load off your CPU, memory, and database.
The Layers of Caching
A truly effective setup isn't about just flipping a switch on one tool. It's about layering different caching methods so they work together, each handling a different part of the journey from the user's browser back to your server.
- Browser Caching: This is the first line of defense. It tells a visitor's web browser to keep local copies of static files like your logo, CSS stylesheets, and JavaScript. The next time they visit, those assets load straight from their own computer. It’s lightning-fast.
- Page Caching: This is what most people mean when they talk about "caching." It creates full, static HTML copies of your pages. For sites built with dynamic platforms like WordPress and Divi—which can be notoriously server-heavy—this is an absolute game-changer.
- Object Caching: This is a more advanced technique that stores the results of complex database queries in super-fast memory (using systems like Redis or Memcached). If you have a database-heavy site, like an e-commerce store or a large blog, this can slash query times and prevent the database from becoming a bottleneck.
Getting these layers right is critical. Research shows that 53% of mobile users will bounce if a site takes longer than three seconds to load. Those aren't just vanity metrics; they have a direct impact on your bottom line.
For a resource-intensive Divi site, a plugin is usually the simplest way to get this all working. You can explore some of the most popular caching plugins to find one that fits your technical comfort level and hosting environment.
The core goal of caching is to make your origin server's job as easy as possible. The more requests you can offload to a cache or CDN, the more horsepower your server has left for the truly dynamic stuff, like processing a sale in an e-commerce checkout.
Extending Your Reach with a CDN
A Content Delivery Network (CDN) is the final, crucial piece of the performance puzzle. A CDN takes copies of your static assets—images, CSS, JavaScript—and distributes them across a global network of servers.
So, when someone in Japan visits your site hosted in Texas, the CDN serves them your images and files from a server in Tokyo, not all the way from the US. This simple shift drastically cuts down latency (the time it takes for data to travel) and makes your site feel significantly faster for your international audience.
This graphic gives a great overview of the key performance indicators you should be watching to see how your caching strategy is paying off.
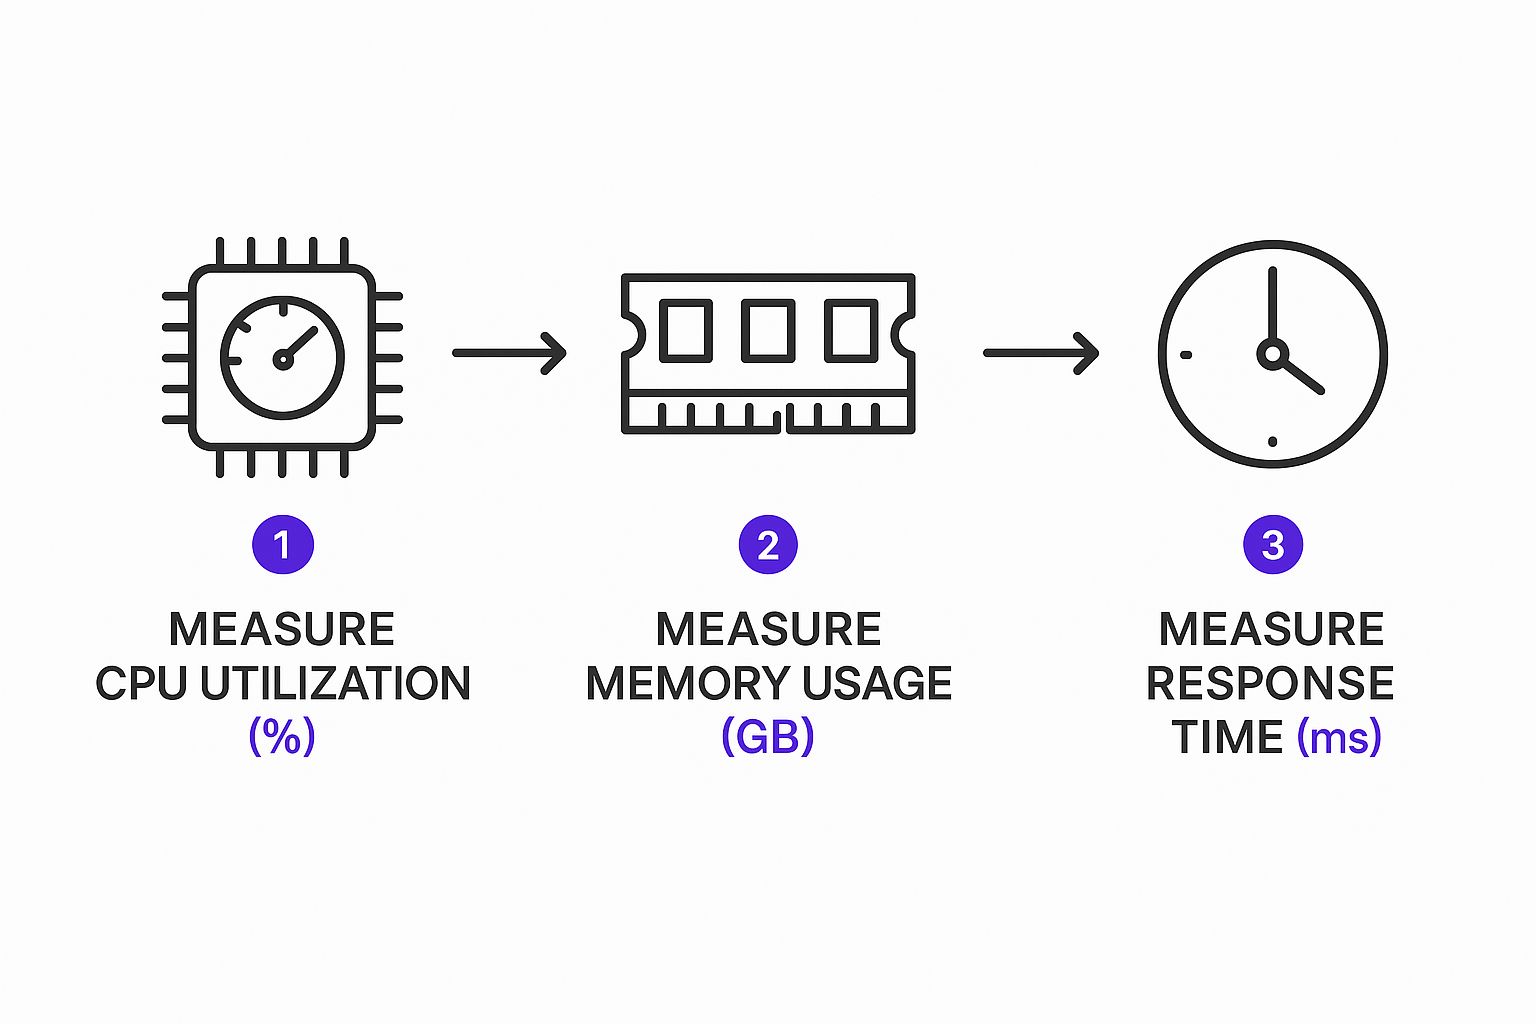
As you can see, metrics like CPU usage and response time are directly improved by a well-configured caching and CDN setup. It's not just about speed; it's about building a more resilient and scalable website.
Even with a top-tier server, sluggish software can bring your site to a screeching halt. Once you’ve handled caching, the next real battleground for server performance optimization is your application code and the database that fuels your site. I've found that these software-level tweaks often give you the biggest bang for your buck, delivering major speed improvements without spending a dime on new hardware.
Think of your website's database as its central nervous system. When it’s slow, everything feels slow. This is especially true for dynamic websites built with WordPress, where a single page view can set off a chain reaction of database queries. In my experience, inefficient queries are one of the most common culprits that can cripple even the most powerful servers.
Find and Fix Slow Database Queries
Your first job is to hunt down the queries that are dragging their feet. You don't need to be a database administrator for this. Many hosting providers offer built-in tools, and brilliant plugins like Query Monitor for WordPress can pinpoint exactly which database interactions are causing delays on any given page.
Once you’ve found a slow query, the goal is to make it run smarter, not harder. Here are two key areas I always check first:
- Database Indexing: Imagine an index is like the index at the back of a book. Instead of flipping through every single page (or row) to find what it needs, the database can use an index to jump straight to the right spot. Adding indexes to columns frequently used in
WHEREclauses can make lookups ridiculously fast. - Table Cleanup: Over time, WordPress databases get cluttered with junk data—post revisions, spam comments, old transient data, you name it. Regularly cleaning this out with a plugin like WP-Optimize keeps your tables lean, mean, and fast.
This isn't just a niche concern anymore. With more than 75% of databases projected to be cloud-based, the demand for sub-second query times is becoming the standard. Efficient database tuning is no longer optional. You can get a deeper dive into these evolving standards over on CyberPanel's blog.
I’ve seen this countless times with Divi sites: a single, poorly coded plugin running a complex, unindexed query on every single page load. It’s a silent killer that can undo all your other optimization work. A simple way to find the offender is to disable your plugins one by one and watch your performance metrics.
This is a perfect example of a tool that helps you visualize where the performance bottlenecks are in your queries.

A visual breakdown like this is incredibly helpful. It shows you exactly which operations within a query are eating up the most resources, telling you precisely where to focus your efforts, like adding a specific index.
Optimize Your Application Code
Beyond the database, the application code itself needs a check-up. For those of us using WordPress and Divi, this almost always boils down to two things: your plugins and your PHP version.
A bloated or badly coded plugin is probably the most common reason I see for a slow Divi website. It's time for a plugin audit. Go through them one by one, deactivating each and measuring the performance impact. If you find a resource hog, hunt for a more lightweight alternative. It’s worth the effort.
Finally, make sure you’re running a modern, stable version of PHP. Every major release of PHP comes with huge performance and security boosts. Just upgrading from an old version like PHP 7.4 to PHP 8.x can make your entire site feel noticeably snappier, all on its own.
Refining Your Server Environment Configuration
With your application and database running smoothly, it's time to pop the hood and tune the engine itself. Most server configurations are set up for broad compatibility right out of the box, not for server performance optimization. By making some smart, safe tweaks, you can make your server’s resources match your website's actual traffic, leading to a much more efficient and stable experience for your visitors.
We're about to get our hands dirty with the core software that serves your site, like Nginx or Apache. These adjustments have a direct impact on how your server juggles incoming visitors, manages connections, and allocates its precious resources.
Adjusting for Real-World Traffic
Think of your web server software (like Nginx or Apache) as your site's air traffic controller. Getting its settings just right ensures it can manage a rush of users without breaking a sweat.
One of the first places to look is the worker_processes setting in Nginx. This tells the server how many worker threads it has available to handle requests. A solid rule of thumb is to set this number to match the number of your server's CPU cores—it’s a simple but incredibly effective starting point.
Another critical setting is keepalive_timeout. This dictates how long the server keeps a connection open after a request is handled. Setting it lower frees up connections faster for new visitors, which is fantastic for busy sites. But be careful—set it too low, and you can actually increase CPU usage. Finding that sweet spot is the goal.
I can't tell you how many times I've seen misconfigured PHP-FPM settings cause crashes, especially on sites built with frameworks like Divi. A classic mistake is setting
pm.max_childrentoo low. When a traffic spike hits, the server runs out of PHP workers and starts throwing those dreaded 504 gateway timeout errors.
Enabling Modern Compression
Beyond just handling connections, how you send your site's data makes a huge difference. By enabling modern compression like Brotli (with Gzip as a fallback), you can seriously shrink the size of your HTML, CSS, and JavaScript files.
Smaller files mean faster downloads and a snappier page load for your visitors. The good news is that most modern hosting control panels let you flip this on with a simple toggle.
Here’s a quick rundown of these critical server settings:
| Setting | What It Controls | Why It Matters |
|---|---|---|
| Worker Processes | The number of simultaneous request handlers. | Prevents CPU bottlenecks by matching workers to available cores. |
| Keep-Alive Settings | How long a single connection stays open. | Balances connection overhead with server resource availability. |
| PHP-FPM Processes | The pool of workers available to execute PHP. | Prevents application timeouts on dynamic sites like WordPress/Divi. |
If there's one thing to take away from this, it's to make small, incremental changes. Tweak one setting, test your site thoroughly under load, and check the performance data. This methodical approach is what separates true optimization from just guessing.
For a broader look at how these tweaks fit into a larger strategy, check out our complete guide on how to improve your website performance. This careful process ensures you’re actually improving things without accidentally creating a new problem.
Building a Proactive Monitoring and Maintenance Plan

Getting your server to run fast is one thing. Keeping it that way is the real test. Server performance optimization isn't a one-and-done task; it’s a constant cycle of watching, tuning, and adapting. If you just set it and forget it, performance will inevitably degrade, and all your hard work will be for nothing.
Think of it as moving from reactive firefighting to calm, controlled prevention. An ongoing plan protects your site from the natural ebb and flow of traffic, new code updates, and the constant barrage of security threats. This is how you ensure your site stays fast and reliable, day in and day out.
Choosing Your Monitoring Tools
First things first, you need to see what’s actually happening on your server in real-time. You can’t fix what you can’t see. A good monitoring tool is your early warning system, flagging small issues before they spiral into site-wide outages.
There are plenty of great tools out there, from simple uptime checkers to deep, complex platforms. Some are even built right into your hosting panel. The goal is to find one that gives you clear, actionable data without drowning you in noise.
My Experience: I've seen teams get completely lost tracking dozens of vanity metrics. You need to focus on what really matters: sudden CPU spikes, memory usage that creeps up and never comes down (a classic memory leak), and high disk I/O wait times. If you set up meaningful alerts for these core metrics, you’ll catch 90% of potential problems before your users do.
To help you get started, let’s look at a few popular tools and what they’re best for.
Server Optimization Tool Comparison
| Tool | Primary Use Case | Best For | Cost |
|---|---|---|---|
| New Relic | Deep application performance monitoring (APM). | Identifying slow code and database queries. | Freemium/Paid |
| Datadog | Comprehensive infrastructure and log monitoring. | Teams needing an all-in-one view of their entire stack. | Paid |
| UptimeRobot | Simple uptime and basic response time checks. | Beginners who just need to know if their site is up or down. | Free/Paid |
| Netdata | Real-time, high-granularity server metrics. | System administrators who want detailed, second-by-second data. | Open-Source |
Choosing the right tool depends on your technical comfort level and how deep you need to go. For most, a combination of UptimeRobot for basic alerts and your host’s built-in monitoring is a great starting point.
Creating a Practical Maintenance Checklist
While monitoring tells you what’s happening now, regular maintenance is what prevents problems from happening in the first place. You don't need a complicated, 50-point inspection. A simple, consistent checklist is more than enough to maintain long-term server health.
Here are the non-negotiables that should be on your schedule:
- Log Rotation and Cleanup: Server logs can quickly balloon in size, chewing up disk space and making it impossible to find what you need during an actual emergency. Automate this to run weekly.
- Security Patching: This is your first line of defense. Regularly apply security updates for your OS, web server (like Nginx or Apache), and applications like PHP.
- Automated Backups: A backup you’ve never tested is just a prayer. Make sure your backups run daily, are stored off-site, and—most importantly—that you’ve actually tried restoring one.
- Database Maintenance: Periodically run your database’s built-in optimization routines. This keeps your tables tidy and your queries fast.
This proactive approach keeps you ahead of trouble instead of constantly reacting to it.
For those of us working with Divi, these same principles apply at the application level, too. We've put together a fantastic resource on this in our guide to 8 Divi maintenance tasks you must perform regularly. When you combine smart server-level checks with diligent website-specific care, you build a system that’s truly resilient.
Server Optimization FAQs
When you start digging into server performance, a handful of questions almost always pop up. Let's clear up some of the most common ones so you can focus your time and energy on what really moves the needle.
How Often Should I Review My Server Performance?
While you should have real-time monitoring running constantly, a deep-dive performance review is a different beast entirely. For most sites, I recommend a thorough analysis at least quarterly. This timeframe is long enough to reveal meaningful trends without getting bogged down by daily noise.
Of course, there are exceptions. You should always run an immediate review after a major event—think a huge traffic spike from a marketing campaign, launching a new site feature, or a core software update. And if you're running a high-traffic e-commerce site? A monthly review is a much safer bet to stay ahead of issues.
Can I Optimize a Server on a Shared Hosting Plan?
This is a classic point of confusion, and the short answer is: not really. On a shared hosting plan, your hands are mostly tied. You don't have the root access needed to tweak server-level configurations like Apache or Nginx settings.
But that doesn't mean you're powerless. Your efforts just need to shift entirely to application-level optimizations. This is where you can still make a big difference.
- Install a top-tier caching plugin. This is non-negotiable on shared hosting.
- Be aggressive with image compression. Every kilobyte counts.
- Keep your code and plugins lean. Deactivate and delete anything you don't absolutely need.
- Use a Content Delivery Network (CDN) to take the load off your server for static files like images and scripts.
If you want to do any true server-level tuning, you’ll need to graduate to a Virtual Private Server (VPS) or a dedicated server. That's where you get the keys to the kingdom.
On shared hosting, you can't tune the engine, but you can definitely lighten the car. The biggest wins come from things you control on your website itself: smart caching, media optimization, and choosing lightweight plugins.
What Is the First Thing to Optimize for the Biggest Impact?
If you're looking for that one magic bullet—the optimization that delivers the biggest bang for your buck—it's almost always a multi-layered caching strategy. This is the absolute lowest-hanging fruit in the world of server performance.
By combining browser caching, page caching (usually via a plugin), and a CDN, you create a powerful trifecta. This setup dramatically cuts down the work your server has to do for each visitor, freeing up precious resources and making everything feel instantly faster.
Will Optimizing My Server Improve My SEO?
Absolutely, and more so now than ever before. Google's focus on user experience, especially through its Core Web Vitals metrics, has made the link between server performance and SEO crystal clear.
A fast, responsive server directly impacts metrics like Largest Contentful Paint (LCP) and Interaction to Next Paint (INP). When you improve these scores, you're sending a strong signal to search engines that your site provides a great user experience. The result? It can lead to higher rankings, more organic traffic, and lower bounce rates.
Ready to create high-impact popups, fly-ins, and mega menus that engage your users without slowing down your site? Divimode offers the powerful tools and expert guidance you need. Discover how Divi Areas Pro can transform your Divi website at https://divimode.com.
More Articles You Will Like